Debug is a key task in any development task. Whether debugging application-level software or a hardware design, a key to productive debug is getting a higher-level view of what is happening in the design. Blindly stepping around in source code or staring at low-level waveforms is rarely a productive approach to debugging. Debug-log messages provide a high-level view of what's happening in an software application, allowing us to better target what source we actually inspect. Testbench logging, coupled with a transaction-level view of interface activity, provides us that higher-level view when verifying IP-level designs. Much of this is lacking when it comes to verifying SoC integration.
Challenges at SoC Level
We face a few unique challenges when doing SoC-integration testing. Software (okay, really firmware) is an integral part of our test environment, but that software is running really really slowly since it is running at RTL-simulation speeds. That makes using debug messages impractical, since simulating execution of the code to produce messages makes our test software run excruciatingly slowly. In addition, the types of issues we are likely to find -- especially early on -- are not at the application-level anyway.
Processor simulation models often provide some form of execution trace, such as ARM's Tarmac file, which provides us a window into what's happening in the software. The downsides, here, are that we end up having to manually correlate low-level execution with higher-level application execution and what's happening in the waveform. There are also some very nice commercial integrated hardware/software debug tools that dramatically simplify the task of debugging software at the source level and correlating that with what's happening in the hardware design -- well worth checking out if you have access.
RISC-V VIP
At IP level, it's common to use Verification IP to relate the signal-level view of implementation with the more-abstract level we use when developing tests and debugging. It's highly desirable, of course, to be able to use Verification IP across multiple IPs and projects. This requires the existence of a common protocol that VIP can be developed to comprehend.
If we want VIP that exposes a higher-level view of a processor's execution, we'll need just such a common protocol to interpret. The good news is that there is such a protocol for the RISC-V architecture: the RISC-V Formal Interface (RVFI). As its name suggests, the RISC-V Formal Interface was developed to enable a variety of RISC-V cores to be formally verified using the same library of formal properties. Using the RVFI as our common 'protocol' to understand the execution of a RISC-V processor enables us to develop a Verification IP that supports any processor that implements the RVFI.
RISC-V Debug BFM
The RISC-V Debug BFM is part of the PyBfms project and, like the other Bus-Functional Models within the project, implements low-level behavior in Verilog and higher-level behavior in Python. Like other PyBfms models, the RISC-V Debug BFM works nicely with cocotb testbench environments.
Instruction-Level Trace
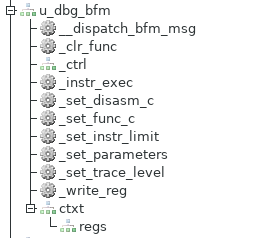
Like other BFMs, the Verilog side of the RISC-V Debug BFM contains various mechanics for converting the input signals to a higher-level instruction trace. Consequently, the signals that expose the higher-level view of software execution are collected in a sub-module of the BFM instance.
C-Level Execution Trace
Seeing instruction execution and register values is useful, but still leaves us looking at software execution at a very low level. This is very limiting, and especially so if we're attempting to understand the execution of software that we didn't write -- booting of an RTOS, for example.
Fortunately, our BFM is connected to Python and there's a readily-available library (pyelftools) for accessing symbols and other information from the software image being executed by the processor core.
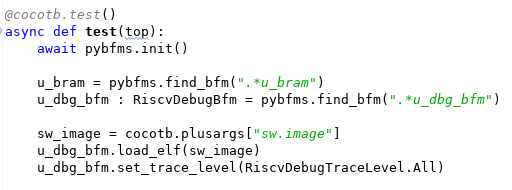
The code snippet above shows our testbench obtaining the path to the ELF file from cocotb, and passing this to the RISC-V Debug BFM. Now, what can we do with a stream of instruction-execution events and an ELF file? How about reconstructing the call stack?
The screenshot above shows the call stack of the Zephyr OS booting and running a short user program. If we need to debug a design failure, we can always correlate it to where the software was when the failure occurred.
The screenshot above covers approximately 2ms of simulation time. At this scale, the signal-level details at the top of the waveform view are incomprehensible. The instruction-level view in the middle are difficult to interpret, though perhaps you could infer something from the register values. However, the C-level execution view at the bottom is still largely legible. Even when function execution is too brief to enable the function name to be legible, sweeping the cursor makes the execution flow easy to follow.
Current Status and Looking Forward
The RISC-V Debug BFM is still early in its development cycle, with additional opportunities for new features (stay tuned!) and a need for increased stability and documentation. That said, feel free to have a look and consider whether having access to the features described above would improve your SoC bring-up experience.
Looking forward in this series of blog posts, we'll be looking next at some of the additional things we can do with the information and events collected by the RISC-V Debug BFM. Among other things, these will allow us to more tightly connect the execution of our Python-based testbench with the execution of our test software.
Finally, the process of creating the RISC-V BFM has me thinking about the possibilities when assembling an SoC from IPs with integrated higher-level debug. What if not only the processor core but also the DMA engine, internal accelerators, and external communication IPs were all able to show a high-level view of what they were doing? It would certainly give the SoC integrator a better view of what was happening, and even facilitate discussions with the IP developer. How would IP with integrated high-level debug improve your SoC bring-up experience?
Disclaimer
The views and opinions expressed above are solely those of the author and do not represent those of my employer or any other party.


very nice explanation of software debug setup using python Matt:)
ReplyDeleteKeep up the great work and educate us more :)