- Wouldn't it be helpful if processor cores came with this type of visibility built-in instead of as a separate bolt-on tool?
- Wouldn't SoC bring-up be simpler if more of the IPs within the SoC exposed an abstracted view of what they were doing internally instead of forcing us to squint at (nearly) meaningless signals and guess?
And, with that, I decided to take a detour to explore this a bit more. Now, it's not unheard of to create an abstracted view of an IP's operation during block-level verification. Often, external monitors that are used to reconstruct aspects of the design state, and that information is used to guide stimulus generation, or as part of correctness checking. Some amount of probing down into the design may also be done.
While this is great for block-level verification, none of this infrastructure can reasonably move forward to the SoC level. That leaves us with extremely limited visibility when trying to debug a failure at SoC level.
If debug and analysis instrumentation were embedded into the IP during its development, an abstracted view of the IP's operation would consistently be available independent of whether it's being verified at block level or whether it's part of a much larger system.
Approach
After experimenting with this a bit, I've concluded that the process of embedding debug and analysis instrumentation within an IP is actually pretty straightforward. The key goals guiding the approach are:
- Adding instrumentation must impose no overhead when the design is synthesized.
- Exposing debug and analysis information must be optional. We don't want to slow down simulation unnecessarily if we're not even taking advantage of the debug information
When adding embedded debug and analysis instrumentation to an IP, our first step is to create a 'socket' within the IP to which we can route the lower-level signals from which we'll construct the higher-level view of the IP's operation. From a design RTL perspective, this socket is an empty module whose ports are all inputs. We instance this 'debug-socket' module in the design and connect the signals of interest to it.
Because the module contains no implementation and only accepts inputs, synthesis tools very efficiently optimize it out. This means that having the debug socket imposes no overhead on the synthesized result.
Of course, we need to plug something into the debug socket. In the example we're about to see, what we put in the socket is a Python-based bus functional model. The same thing could, of course, be done with a SystemVerilog/UVM agent as well.
Let's look at a simple example of adding instrumentation to an existing IP. Over the years, I've frequently used the wb_dma core from opencores.org as a learning vehicle, and when creating examples. I created my first OVM testbench around the wb_dma core, learned how to migrate to UVM with it, and have even used it in SoC-level examples.
 |
| DMA Block Diagram |
The wb_dma IP supports up to 31 DMA channels internally that all communicate with the outside world via two initiator interfaces and are controlled by a register interface. It isn't overly complex, but determining what the DMA engine is attempting to do by observing traffic on the interfaces is a real challenge!
When debugging a potential issue with the DMA, the key pieces of information to have are:
- When is a channel active? In other words, when does it have pending transfers to perform?
- When a channel is active, what is it's configuration? In other words, source/destination address, transfer size, etc.
- When is a channel actually performing transfers?
While there may be additional things we'd like to know, this is a good start.
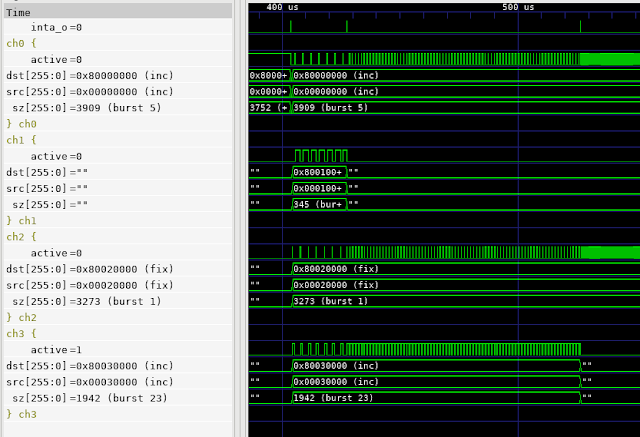
The waveform trace above shows the abstracted view of operation produced for the DMA engine. Note the groups of traces that each describe what one channel is doing. The dst, src, and sz traces describe how an active channel is configured. If the channel is inactive, these traces are blanked out. The active signal is high when the channel is actually performing transfers. Looking at the duty cycle of the active signals across simultaneously-active channels gives us a good sense for whether a given channel is being given sufficient access to the initiator interfaces.
Let's dig into the details a bit more on how this is implemented.
DMA Debug/Analysis Socket
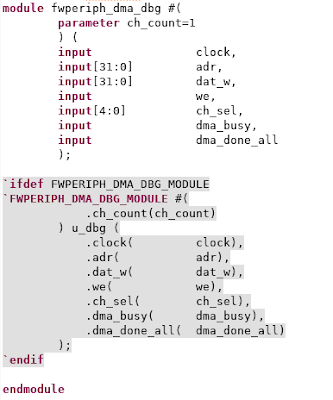
We first need to establish a debug/analysis "socket" -- an empty module -- that has access to all the signals we need. In the fwperiph-dma IP (a derivative of the original wb_dma project), this socket is implemented by the fwperiph_dma_debug module.
And, that's all we need. The debug/analysis socket has access to:
- Register writes (adr, dat_w, we)
- Information on which channel is active (ch_sel, dma_busy)
- Information on when a transfer completes (dma_done_all)
Note that, within the module, we have an `ifdef block allowing us to instance a module. This is the mechanism via which we insert the actual debug BFM into the design. Ideally, we would use the SystemVerilog bind construct, but this IP is designed to support a pure-Verilog flow. The `ifdef block accomplishes roughly the same thing as a type bind.
Debug/Analysis BFM
The debug/analysis BFM has two components. One is a Verilog module that translates from the low-level signals up to operations such as "write channel 2 CSR" and "transfer on channel 3 complete". This module is about 250 lines of code, much of it of low complexity.
The other component of the BFM is the Python class that tracks the higher-level view of what channels are active, how they are configured, and ensures that the debug information exposed in signal traces is updated. The Python BFM can also provide callbacks to enable higher-level analysis in Python. The Python BFM is around 150 lines of code.
So, in total we have ~400 lines of code dedicated to debug and analysis -- a similar amount and style to what might be present in a block-level verification environment. The difference, here, is that this same code is reusable when we move to SoC level.
Results
Thus far, I've mostly used the waveform-centric view provided by the DMA-controller integrated debug. Visual inspection isn't the most-efficient way to do analysis, but I've already had a couple of 'ah-ha' moments while developing some cocotb-based tests for the DMA controller.
Looking Forward
I've found the notion of IP-integrated debug and analysis instrumentation very intriguing, and early experience indicates that it's useful in practice. It's certainly true that not all IPs benefit from exposing this type of information, but my feeling is that many that contain complex, potentially-parallel, operations exposed via simple interfaces will. Examples, such as DMA engines, processor cores, and PCIe/USB/Ethernet controllers come to mind. And, think how nice it would be to have IP with this capability built-in!
In this blog post, we've looked at the information exposed via the waveform trace. This is great to debug the IP's behavior -- while it's being verified on its own or during SoC bring-up. At the SoC level, the higher-level information exposed by at the Python level may be even more important. As we move to SoC level, we become increasingly interested in validation -- specifically, confirming that we have configured the various IPs in the design to support the intended use, but not over-configured them and, thus, incurred excess implementation costs. My feeling is that the information exposed at the Python level can help to derive performance metrics to help answer these questions.
This has been a fun detour, and I plan to continue exploring it in the future -- especially, how it can enable higher-level analysis in Python. But, now it's time to look at how we can bring the embedded-software and hardware (Python) portions of our SoC testbench closer together. Look for that in the new few weeks.
References
- wb_dma IP (original Wishbone DMA IP) -- https://opencores.org/projects/wb_dma
- fwperiph-dma IP (Modified DMA IP) -- https://github.com/Featherweight-IP/fwperiph-dma
Disclaimer
The views and opinions expressed above are solely those of the author and do not represent those of my employer or any other party.


