Showing posts with label PyBFMs. Show all posts

Sunday, April 18, 2021

SoC Integration Testing: Hw/Sw Coordination (Part 2)


Controlling the outside world -- specifically interface BFMs -- from embedded software is critical to SoC integration tests that exercise interface IP. In the last post, we showed how to pass data from embedded software to Python by tracing execution of the processor core and reading the mirrored values of registers and memory to obtain parameter values. While functional, doing things in this way is highly specific to one message-passing approach and is pretty labor intensive. In this post, we'll add some abstraction and automation to improve usability and scalability.


Design Goals


While we're initially focused on providing a nice automated way to communicate between embedded software and the test harness in a simulation environment, the design goals go beyond this. The diagram above shows the basic architecture. Endpoints provide a portal for one environment to call APIs in another environment. Each endpoint supports a known set of APIs, and different endpoints will support different sets of APIs. 

Each environment interacts with APIs on an endpoint without needing to know how communication is implemented. For example, execution trace might be used to implement processor to Python communication in a simulation-based environment. When the design is synthesized to FPGA, communication might be implemented via an external interface. With appropriate abstraction, neither the test software running on the processor nor the Python test code should need to change despite the fact that data is being moved in very different ways. 

In order for this to be feasible, we'll need to collect some meta-data about the APIs.


Example

I always find an example to be helpful, so let's look at the enhancements to the flow in the context of a simple example.


The diagram above shows the key elements of a very small SoC called Tiny SoC. We can test many aspects of integration using just software on the processor. For example, we can read registers in the peripheral devices and check that they are correct. We can carry out DMA transfers. But, we need to control the outside world when testing the full path from software through the UART and SPI devices.

Bus functional models (BFMs) or Verification IP (VIP) provide very effective ways to interact with interface protocols from testbench code. What we need in addition is a way to control these BFMs from the software running on the core in the design.


Capturing the API

Let's focus on the UART for now. Our UART BFM provides a detailed API for configuring individual attributes of the UART protocol (eg baud-rate divisor) and for interacting with the UART protocol a byte at a time. That's fine for IP-level testing, but is a bit too low-level for software-driven testing.

For software-driven testing, we want to instruct the BFM to do some reasonable amount of work and let it go. To help with this, the UART BFM defines a higher-level API intended for use by software. 

An example of that higher-level API is shown above. Calling the uart_bfm_tx_bytes_incr API causes the BFM to begin sending a stream of bytes starting with a specific value and incrementing. There is another API that instructs the BFM to expect to receive a stream of bytes sent by the software running on the processor.

To enable automation, we describe the Python API that we will call from embedded software using special annotations. We collect related APIs together in a class, and identify whether these methods are exported by the Python environment and will be called by the embedded software, or are imported by the Python and will be called by Python code. 


Since we want embedded software to call this API, the API is considered to be exported by Python. You can also see the configuration function that updates the UART's configuration (eg baud rate).

Each of the method parameters is given a Python3 type annotation. This enables the Python libraries to know the type of each parameter and collect the right data to pass when the functions are called. 

On the C side, we simply need to have functions with the same signature as what we've captured in the Python API definition.
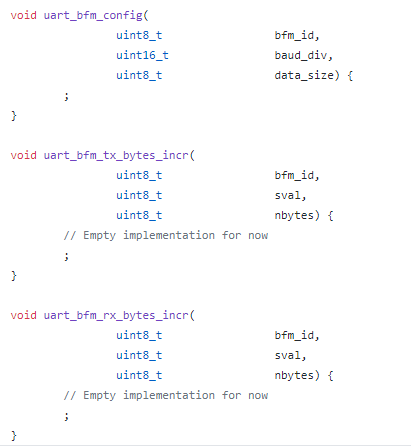

While the code shown above (link) is hand-coded, we could generate it automatically based on what is specified in the Python API definition. 


Connecting to Implementation: Python

Connecting all of this up on the Python side involves connecting the relevant BFMs and API implementations together. 
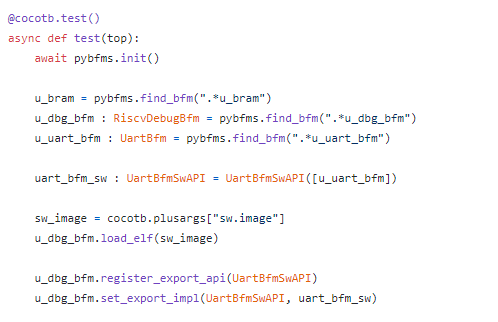

The snippet above is from the cocotb test that runs when a baremetal software test is run (link). At the beginning of simulation, the test locates the relevant BFMs. The u_dbg_bfm is the tracer BFM that monitors execution of software on the processor core. This BFM implements an Endpoint, as shown in the diagram at the beginning of the post. The u_uart_bfm is the BFM connected to the UART interface on TinySoC. 

Once we have all the BFMs, we can create an instance of the higher-level UART BFM API (uart_bfm_sw) and tell the debug BFM that it should handle the embedded software calling these APIs.


Example C-Test
With the BFMs connected on the Python side, we can now focus on how to interact with the BFM from the software test.
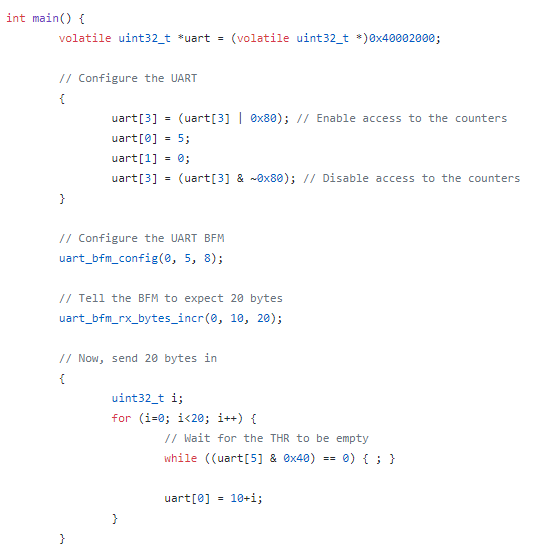
The software test snippet above transmits some data via the UART to the waiting UART BFM to check (link). Before we can send data, both the UART IP and the external BFM need to be configured in the same way. We program the UART IP via its registers, and call the uart_bfm_config function to cause the corresponding Python method to be invoked. This will cause the UART BFM mode to be configured.

Next, we call the uart_bfm_rx_bytes_incr to tell the UART BFM that it should expect to receive 20 bytes. It should expect the first byte to have a value 10 and subsequent bytes to increment by one. By telling the BFM what to expect, our test is self-checking and the required amount of interaction is small.

Finally, we again interact with the UART IP actually send the data that the BFM is expecting. 

Next Steps
The API definition and Endpoint architecture described in the post above provides a modular way to capture the APIs used to communicate across environments. Because the API signature is captured in machine-readable way, it also enables the use of automation when implementing the APIs for different environments. 

As I mentioned at the beginning of the post, the API and Endpoint architecture is designed so it can be applied in many verification environments -- it's certainly not restricted to just communicating between embedded software test and the test harness. I've been interested for a while in methodology for creating and verifying firmware along with the IP that it controls such that it's ready to go when SoC-integration testing begins. My next post will begin exploring how to create, verify, and deliver firmware along with an IP.

References


Disclaimer
The views and opinions expressed above are solely those of the author and do not represent those of my employer or any other party.

Sunday, February 28, 2021

SoC Integration Testing: IP-Integrated Debug and Analysis


One of the things I've always liked about side projects is the freedom to stop and explore a topic of interest as it comes up. One such topic that came up for me recently is IP-integrated debug and analysis instrumentation. I started thinking about this after the last post (link) which focused on exposing a higher-abstraction-level view of processor-core execution. My initial approach to doing this involved a separate bus-functional model (BFM) intended to connect to any RISC-V processor core via an interface. After my initial work on this bus-functional model that could be bolted onto a RISC-V core, two things occurred to me:
  • Wouldn't it be helpful if processor cores came with this type of visibility built-in instead of as a separate bolt-on tool?
  • Wouldn't SoC bring-up be simpler if more of the IPs within the SoC exposed an abstracted view of what they were doing internally instead of forcing us to squint at (nearly) meaningless signals and guess?
And, with that, I decided to take a detour to explore this a bit more. Now, it's not unheard of to create an abstracted view of an IP's operation during block-level verification. Often, external monitors that are used to reconstruct aspects of the design state, and that information is used to guide stimulus generation, or as part of correctness checking. Some amount of probing down into the design may also be done.

While this is great for block-level verification, none of this infrastructure can reasonably move forward to the SoC level. That leaves us with extremely limited visibility when trying to debug a failure at SoC level.

If debug and analysis instrumentation were embedded into the IP during its development, an abstracted view of the IP's operation would consistently be available independent of whether it's being verified at block level or whether it's part of a much larger system.

Approach

After experimenting with this a bit, I've concluded that the process of embedding debug and analysis instrumentation within an IP is actually pretty straightforward. The key goals guiding the approach are:
  • Adding instrumentation must impose no overhead when the design is synthesized. 
  • Exposing debug and analysis information must be optional. We don't want to slow down simulation unnecessarily if we're not even taking advantage of the debug information
When adding embedded debug and analysis instrumentation to an IP, our first step is to create a 'socket' within the IP to which we can route the lower-level signals from which we'll construct the higher-level view of the IP's operation. From a design RTL perspective, this socket is an empty module whose ports are all inputs. We instance this 'debug-socket' module in the design and connect the signals of interest to it.

Because the module contains no implementation and only accepts inputs, synthesis tools very efficiently optimize it out. This means that having the debug socket imposes no overhead on the synthesized result.

Of course, we need to plug something into the debug socket. In the example we're about to see, what we put in the socket is a Python-based bus functional model. The same thing could, of course, be done with a SystemVerilog/UVM agent as well.

Example - DMA Engine

Let's look at a simple example of adding instrumentation to an existing IP. Over the years, I've frequently used the wb_dma core from opencores.org as a learning vehicle, and when creating examples. I created my first OVM testbench around the wb_dma core, learned how to migrate to UVM with it, and have even used it in SoC-level examples. 

DMA Block Diagram

The wb_dma IP supports up to 31 DMA channels internally that all communicate with the outside world via two initiator interfaces and are controlled by a register interface. It isn't overly complex, but determining what the DMA engine is attempting to do by observing traffic on the interfaces is a real challenge!

When debugging a potential issue with the DMA, the key pieces of information to have are:
  • When is a channel active? In other words, when does it have pending transfers to perform?
  • When a channel is active, what is it's configuration? In other words, source/destination address, transfer size, etc.
  • When is a channel actually performing transfers?
While there may be additional things we'd like to know, this is a good start.


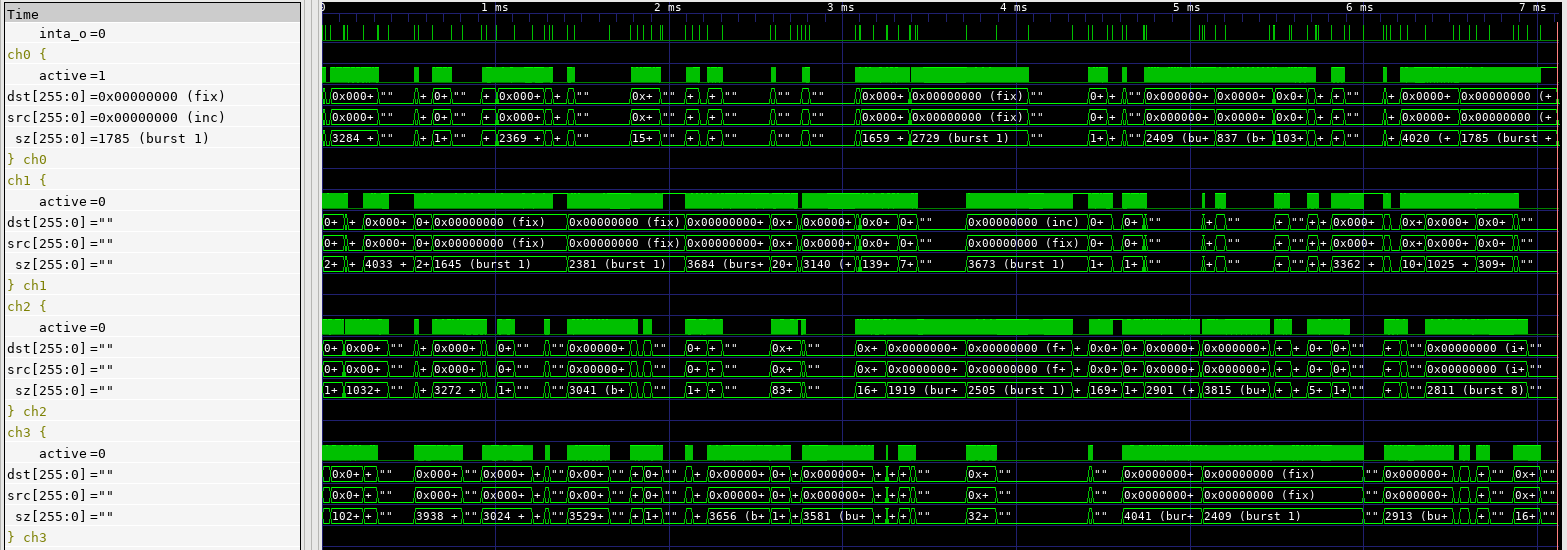
The waveform trace above shows the abstracted view of operation produced for the DMA engine. Note the groups of traces that each describe what one channel is doing. The dst, src, and sz traces describe how an active channel is configured. If the channel is inactive, these traces are blanked out. The active signal is high when the channel is actually performing transfers. Looking at the duty cycle of the active signals across simultaneously-active channels gives us a good sense for whether a given channel is being given sufficient access to the initiator interfaces. 

Let's dig into the details a bit more on how this is implemented.

DMA Debug/Analysis Socket
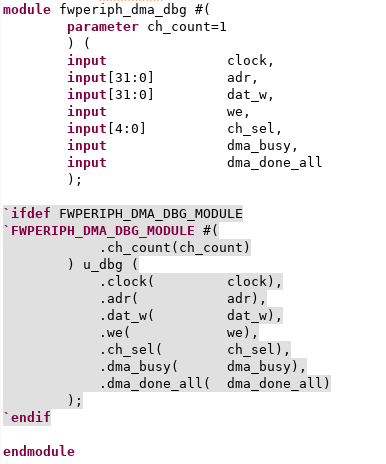
We first need to establish a debug/analysis "socket" -- an empty module -- that has access to all the signals we need. In the fwperiph-dma IP (a derivative of the original wb_dma project), this socket is implemented by the fwperiph_dma_debug module


And, that's all we need. The debug/analysis socket has access to:
  • Register writes (adr, dat_w, we)
  • Information on which channel is active (ch_sel, dma_busy)
  • Information on when a transfer completes (dma_done_all)
Note that, within the module, we have an `ifdef block allowing us to instance a module. This is the mechanism via which we insert the actual debug BFM into the design. Ideally, we would use the SystemVerilog bind construct, but this IP is designed to support a pure-Verilog flow. The `ifdef block accomplishes roughly the same thing as a type bind.

Debug/Analysis BFM

The debug/analysis BFM has two components. One is a Verilog module that translates from the low-level signals up to operations such as "write channel 2 CSR" and "transfer on channel 3 complete". This module is about 250 lines of code, much of it of low complexity. 

The other component of the BFM is the Python class that tracks the higher-level view of what channels are active, how they are configured, and ensures that the debug information exposed in signal traces is updated. The Python BFM can also provide callbacks to enable higher-level analysis in Python. The Python BFM is around 150 lines of code. 

So, in total we have ~400 lines of code dedicated to debug and analysis -- a similar amount and style to what might be present in a block-level verification environment. The difference, here, is that this same code is reusable when we move to SoC level. 

Results

Thus far, I've mostly used the waveform-centric view provided by the DMA-controller integrated debug. Visual inspection isn't the most-efficient way to do analysis, but I've already had a couple of 'ah-ha' moments while developing some cocotb-based tests for the DMA controller. 


I was developing a full-traffic test that was intended to keep all DMA channels busy for most of the time when I saw the pattern in the image above. Notice that a transfer starts on each channel (left-hand side), and no other transfers start until all the previously-started transfers are complete (center-screen). Something similar happens on the right-hand side of the trace. Seeing this pattern graphically alerted me that my test was unintentionally waiting for all transfers to complete before starting the next batch, and thus artificially throttling activity on the DMA engine.


With the test issue corrected, the image above shows expected behavior where new transfers start while other channels are still busy.


Looking Forward

I've found the notion of IP-integrated debug and analysis instrumentation very intriguing, and early experience indicates that it's useful in practice. It's certainly true that not all IPs benefit from exposing this type of information, but my feeling is that many that contain complex, potentially-parallel, operations exposed via simple interfaces will. Examples, such as DMA engines, processor cores, and PCIe/USB/Ethernet controllers come to mind. And, think how nice it would be to have IP with this capability built-in!

In this blog post, we've looked at the information exposed via the waveform trace. This is great to debug the IP's behavior -- while it's being verified on its own or during SoC bring-up. At the SoC level, the higher-level information exposed by at the Python level may be even more important. As we move to SoC level, we become increasingly interested in validation -- specifically, confirming that we have configured the various IPs in the design to support the intended use, but not over-configured them and, thus, incurred excess implementation costs. My feeling is that the information exposed at the Python level can help to derive performance metrics to help answer these questions.

This has been a fun detour, and I plan to continue exploring it in the future -- especially, how it can enable higher-level analysis in Python. But, now it's time to look at how we can bring the embedded-software and hardware (Python)  portions of our SoC testbench closer together. Look for that in the new few weeks.

References

Disclaimer
The views and opinions expressed above are solely those of the author and do not represent those of my employer or any other party.


Saturday, January 30, 2021

SoC Integration Testing: Higher-Level Software Debug Visibility


Debug is a key task in any development task. Whether debugging application-level software or a hardware design, a key to productive debug is getting a higher-level view of what is happening in the design. Blindly stepping around in source code or staring at low-level waveforms is rarely a productive approach to debugging. Debug-log messages provide a high-level view of what's happening in an software application, allowing us to better target what source we actually inspect. Testbench logging, coupled with a transaction-level view of interface activity, provides us that higher-level view when verifying IP-level designs. Much of this is lacking when it comes to verifying SoC integration.

Challenges at SoC Level
We face a few unique challenges when doing SoC-integration testing. Software (okay, really firmware) is an integral part of our test environment, but that software is running really really slowly since it is running at RTL-simulation speeds. That makes using debug messages impractical, since simulating execution of the code to produce messages makes our test software run excruciatingly slowly. In addition, the types of issues we are likely to find -- especially early on -- are not at the application-level anyway. 

Processor simulation models often provide some form of execution trace, such as ARM's Tarmac file, which provides us a window into what's happening in the software. The downsides, here, are that we end up having to manually correlate low-level execution with higher-level application execution and what's happening in the waveform. There are also some very nice commercial integrated hardware/software debug tools that dramatically simplify the task of debugging software at the source level and correlating that with what's happening in the hardware design -- well worth checking out if you have access.

RISC-V VIP
At IP level, it's common to use Verification IP to relate the signal-level view of implementation with the more-abstract level we use when developing tests and debugging. It's highly desirable, of course, to be able to use Verification IP across multiple IPs and projects. This requires the existence of a common protocol that VIP can be developed to comprehend. 

If we want VIP that exposes a higher-level view of a processor's execution, we'll need just such a common protocol to interpret. The good news is that there is such a protocol for the RISC-V architecture: the RISC-V Formal Interface (RVFI). As its name suggests, the RISC-V Formal Interface was developed to enable a variety of RISC-V cores to be formally verified using the same library of formal properties. Using the RVFI as our common 'protocol' to understand the execution of a RISC-V processor enables us to develop a Verification IP that supports any processor that implements the RVFI.

RISC-V Debug BFM
The RISC-V Debug BFM is part of the PyBfms project and, like the other Bus-Functional Models within the project, implements low-level behavior in Verilog and higher-level behavior in Python. Like other PyBfms models, the RISC-V Debug BFM works nicely with cocotb testbench environments.

Instruction-Level Trace
Like other BFMs, the Verilog side of the RISC-V Debug BFM contains various mechanics for converting the input signals to a higher-level instruction trace. Consequently, the signals that expose the higher-level view of software execution are collected in a sub-module of the BFM instance.


The image above shows the elements within the debug BFM. The ctxt scope contains the higher-abstraction view of software execution, while the regs scope inside it contains the register state.


The first level of debug visibility that we receive is at the instruction level. The RISC-V Debug BFM exposes a simple disassembly of the executed instructions on the disasm signal within the ctxt scope. Note that you need to set the trace format to ASCII or String (depending on your waveform viewer) to see the disassembly. 


C-Level Execution Trace
Seeing instruction execution and register values is useful, but still leaves us looking at software execution at a very low level. This is very limiting, and especially so if we're attempting to understand the execution of software that we didn't write -- booting of an RTOS, for example. 

Fortunately, our BFM is connected to Python and there's a readily-available library (pyelftools) for accessing symbols and other information from the software image being executed by the processor core.


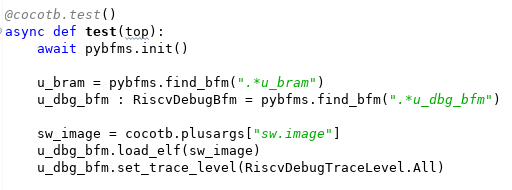
The code snippet above shows our testbench obtaining the path to the ELF file from cocotb, and passing this to the RISC-V Debug BFM. Now, what can we do with a stream of instruction-execution events and an ELF file? How about reconstructing the call stack?


The screenshot above shows the call stack of the Zephyr OS booting and running a short user program. If we need to debug a design failure, we can always correlate it to where the software was when the failure occurred. 


The screenshot above covers approximately 2ms of simulation time. At this scale, the signal-level details at the top of the waveform view are incomprehensible. The instruction-level view in the middle are difficult to interpret, though perhaps you could infer something from the register values. However, the C-level execution view at the bottom is still largely legible. Even when function execution is too brief to enable the function name to be legible, sweeping the cursor makes the execution flow easy to follow.

Current Status and Looking Forward
The RISC-V Debug BFM is still early in its development cycle, with additional opportunities for new features (stay tuned!) and a need for increased stability and documentation. That said, feel free to have a look and consider whether having access to the features described above would improve your SoC bring-up experience.

Looking forward in this series of blog posts, we'll be looking next at some of the additional things we can do with the information and events collected by the RISC-V Debug BFM. Among other things, these will allow us to more tightly connect the execution of our Python-based testbench with the execution of our test software.

Finally, the process of creating the RISC-V BFM has me thinking about the possibilities when assembling an SoC from IPs with integrated higher-level debug. What if not only the processor core but also the DMA engine, internal accelerators, and external communication IPs were all able to show a high-level view of what they were doing? It would certainly give the SoC integrator a better view of what was happening, and even facilitate discussions with the IP developer. How would IP with integrated high-level debug improve your SoC bring-up experience?

Disclaimer
The views and opinions expressed above are solely those of the author and do not represent those of my employer or any other party.

Tuesday, December 31, 2019

2019 - The "Nights and Weekends Projects" Year in Review


It's almost the end of 2019, and I've been thinking back over the year as well as thinking ahead to 2020. In past years, I've often evaluated my "nights and weekends" projects using the same metrics I'm evaluated on at work: projects completed, and results obtained. This year, I've started looking my my "nights and weekends" efforts through a different lens focused more on the knowledge I've gained than just what I've produced.
As an aside, given the cover image, I do find it somewhat ironic that almost none of the knowledge I gained this year came from printed and bound books. Growing up with a love of libraries, and the fascinating collections of books they contained, it's both sad to think that knowledge is no longer concentrated there, and amazing to realize what a wealth of knowledge is now so easily-accessible just a short search away.

Looking back, there are two themes that run through several areas that I worked in across the year. The first of these is making software more modular, collaborative, and accessible. The second is Python. That's not all, though. So, let's get right to it!

Software Packaging and Distribution
Professionally, I come from a standard commercial-software background, and have often looked at open source through a similar lens. Specifically, I've often focused on software that can be packaged such that it's easily accessible to end users. This means bundling dependencies, providing installers, etc (see DVKit, a 'batteries-included' IDE for verification engineers).

This application-centric approach works well so long as the elements of functionality being distributed are relatively small in number, and the ways in which they need to be combined are fairly limited. This approach breaks down when the elements of functionality are relatively large in number, and need to be combined in many ways. In short, the more modular software becomes, the less feasible typical application-centric packaging becomes.

I've been dabbling for a few years in RTL design and verification. In this space, the verification environment for a given design will depend on many small elements of functionality -- utility libraries, reusable verification IP, etc. Bundling the dependencies with the verification environment quickly leads to projects that require lots of disk space. On the other hand, forcing users to download and install all the dependencies presents a significant barrier to new users.

One of the biggest reasons that I've spent so much time with Python this past year is that the Python ecosystem appears to provide a solution to this challenge of packaging and easily distributing small elements of functionality. Over the course of the year, I've spent time looking at Conda as a way of making application-level features more modular and easily-accessible. I've also spent time learning about how to package Python extension libraries (both with and without native library components) for distribution on PyPi, a repository for distributing Python packages.


New Approaches to Embedded DSLs
I've been involved in several projects over the years that have used C++ to provide a language-like user experience via C++ overloaded operators and macros. While there are certainly downsides to these embedded domain-specific languages in terms of error messaging and extensibility, an embedded domain-specific language can be a great way to prototype a language-based user interface before committing to the work of defining a first-class language and creating the parsing and processing infrastructure. It's also a very helpful approach for exploring new techniques in the context of existing languages.

C++ support for macros and operator overloading have been used for embedded DSLs from the beginning. However, using just these features tends to lead to somewhat awkward syntax, since operator overloading only supports expressions. C++11 (and beyond) brings new features, such as lambda expressions, and I spent time investigating these mechanisms and their impact on supporting expressing more-complex constructs in a more-natural way.

While the new C++11 features definitely showed promise, I started to wonder what support Python provided for implementing embedded domain-specific languages. As it turns out, Python provides some very powerful capabilities. Python supports overloading more operators than C++, and supports introspection into the code described by the user. I definitely intend to revisit embedded domain-specific languages captured in Python in 2020!

Constraint Solvers
Highly-capable constraint solvers that are available under permissive open-source licenses are becoming widely available, and I'm seeing these solvers applied to a range of interesting tasks. The CRAVE library for generating random stimulus has been around for some time. Several tools are leveraging available SMT solvers for model checking. Constraint solvers are even being applied for graphical layout of diagrams!

Given the range of applications to which solvers lend themselves, I thought it would be worth having a bit more hands-on knowledge. I spent some time learning about the Z3 solver API before concluding that, while the API is elegant and comprehensive, it's also more-complicated that what I need. I subsequently shifted to looking at the Boolector solver API, which is smaller and simpler.

The Boolector solver provides a Python binding, which is built along with the solver. This means that a user needs to manually build Boolector in order to use a Python package that uses the Boolector solver. Fortunately, I'd been learning about packaging and distributing Python extension libraries, and this this provided a perfect place to try this out. The Boolector Python library (PyBoolector) on PyPi is the result of this work.

Python for Verification
My background in verification is rooted in SystemC, SystemVerilog, and UVM. All very mainstream languages and methodologies in the commercial design and functional verification space. As I spent more time exploring Python and the modular and collaborative packaging it supports, I concluded that it made sense to investigate using Python for functional verification.

I spent time learning about cocotb, the most popular functional verification library in Python that I'm aware of. I also spent time learning about Python's back-end C API and how to structure bus-functional models to integrate at the procedure level with Python.

Actually, the more time I spend looking at Python for verification, the more possibilities I see. Definitely look for more on this topic in 2020!

In most areas, I've been quite happy with Python for verification. The object-oriented language features fit the requirements for high-level verification, and the easy availability of utility packages simplifies dealing with project dependencies. The one thing I've been dissatisfied with is support for static checking. I've used statically-typed languages for most application development. These languages have the advantage that the compiler can identify misuse of types before running the application. Dynamically-typed languages, such as Python and TCL, end up discovering type-misuse issues (eg passing an object to a method that expects an object of a different type) at runtime. One target for 2020 is learning more about what can be done to address this issue. Lint tools such as Pylint help, and my hope is to discover more tools and methodologies that help to close this gap.

RTL Design Skills
When I undertook the 2018 RISC-V Soft Core Contest, It had been quite a few years since I'd done any RTL design. Going through the design work for that project helped me brush up my skills quite a bit, but I knew I had quite a ways to go to be proficient. When the 2019 contest, centered around software security, came along, I knew it was a good opportunity to both learn more about software security vulnerabilities and improve my RTL design skills.

In addition to improving my RTL design skills, I learned a couple of things from initially attempting to add a few new features (multiplication, compressed instructions, security extensions) to my 2018 soft core. First, I had succeeded at writing some very good spaghetti RTL that wasn't modular enough to support extensibility. Furthermore, I didn't have sufficient tests to effectively and efficiently catch bugs introduced by adding new features.

Over the course of the 2019 project, I did a complete rewrite of the Featherweight RISC core. The more-modular structure of the rewritten core lends itself even better to bounded model checking, and I found this to be extremely helpful in catching and diagnosing bugs introduced during development and integration.

Going through this process also helped to improve my knowledge of RTL constructs that result in good efficient implementation, and which do not.


Looking Forward
2019 has been a great year for learning about more corners of the technical world. Looking forward to 2020, I see more work with Python, transitioning more of my existing projects over to cloud-based continuous integration, and more work with Python in the functional verification space. What will I learn along the way? Stay tuned for more blog posts across 2020 to find out!

As we come to the end of 2019 and the beginning of a new year (and new decade), I wish you happy holidays, a happy new year, and a 2020 ahead that is full of learning!

Disclaimer
The views and opinions expressed above are solely those of the author and do not represent those of my employer or any other party.
Saturday, December 14, 2019

Writing a Task-Based Cocotb BFM


Background
The purpose of a Bus Functional Model (BFM) is to enable interacting with a design via a given protocol at a higher level of abstraction than the signal-level protocol, while knowing the bare minimum about the details of that protocol. Verification IP goes beyond these benefits to provide test plans, functional coverage, test sequence, and often protocol-specific benefits like compliance test suites.

In order to realize any these benefits of having a BFM, one first needs to exist. So, let's take a look at what it takes to create a task-based Cocotb BFM for a very simple ready/valid protocol.


The ready/valid protocol is simple, but useful. Data is exchanged between two blocks on a clock edge when both ready and valid are active (high). The initiator controls the valid signal, the target controls the ready signal. That's all there is to the protocol.

Before we get into the details, a few words about the structure of a task-based Cocotb BFM. There are two key components:

  • A Python class that provides the API used by the test writer, and defines the lower-level API used to actually interact with the HDL portion of the BFM
  • An HDL module that performs the conversion between the commands sent from Python and signals, and vice-versa.


Both of these aspects of a task-based BFM are collected together in a Python package that is typically named with the protocol implemented by the BFM (rv, or ready-valid, in this case).

Python API

The Python portion of a task-based Cocotb BFM is captured as a Python class. I use camel-case names for classes, so the ready/value output (initiator) BFM is ReadyValidDataOutBFM.

class ReadyValidDataOutBFM():

    def __init__(self):
        self.busy = Lock()
        self.ack_ev = Event()

The two core data items shown in the class initializer are likely to be found in every BFM. Cocotb supports multi-threaded tests using Python co-routines. Our BFM will use the 'busy' lock to ensure that only one Python thread can use the BFM at a time. It will use the 'ack_ev' event to interact with the HDL portion of the BFM.

As I mentioned earlier, there are typically two API layers that we need to define: the API that the user calls, and a lower-level API that is used to control the BFM's HDL code inside the simulation.

Let's start with the user layer, since that's quite simple. The user's test will use the ready/valid initiator BFM to write data to a target ready/valid interface. Let's call the public method 'write_c', to denote that this is a Python co-routine that writes data out from the BFM.

   @cocotb.coroutine
    def write_c(self, data):
        '''
        Writes the specified data word to the interface
        '''
        
        yield self.busy.acquire()
        self._write_req(data)

        # Wait for acknowledge of the transfer
        yield self.ack_ev.wait()
        self.ack_ev.clear()

        self.busy.release()

Before getting into the implementation details, let's look at the second API layer -- the one that interacts directly with the BFM. The low-level API must be non-blocking in order to work with the full range of simulation and execution environments that must be supported. This means that we need to split the write operation into two pieces: an outbound call to initiate a write, and an inbound call from the BFM to notify that the write is complete.

    @cocotb.bfm_import(cocotb.bfm_uint32_t)
    def _write_req(self, d):
        pass
    
    @cocotb.bfm_export()
    def _write_ack(self):
        self.ack_ev.set()

Note that the low-level API functions are prefixed with '_', denoting that this is an internal API and not intended to be called directly by the user.


HDL BFM

The HDL portion of the BFM also has two aspects. One is synchronous synthesizable code, while the other implements the interface to the synchronous code. Both of these are contained within a Verilog module, shown below:

module rv_data_out_bfm #(
  parameter DATA_WIDTH = 8
) (
  input clock,
  input reset,
  output reg[DATA_WIDTH-1:0] data,
  output reg data_valid,
  input data_ready
);

reg[DATA_WIDTH-1:0] data_v = 0;
reg data_valid_v = 0;

This module is instantiated in the HDL testbench and connected to the signals on the appropriate design interface. The data_v and data_valid_v variables are used to interface between the synchronous and control code inside the BFM.

We'll look at the interface code first. The Verilog task below implements the Python _write_reg method shown above.

task _write_req(reg[63:0] d);
begin
data_v = d;
data_valid_v = 1;
end
endtask


Note that the interface task is non-blocking, and simply sets values on variables within the module -- in this case, storing the data to be written and indicating that there is new data to transfer.

The synchronous logic controls the module signals based on the variables set by the interface tasks. This code is shown below:

always @(posedge clock) begin
  if (reset) begin
    data_valid <= 0;
    data <= 0;
  end else begin
    data_valid <= data_valid_v;
    data <= data_v;
          if (data_valid && data_ready) begin
      _write_ack();
      data_valid_v = 0;
    end
  end
end

This synchronous logic propagates the variables that were set in the interface task. When both the data_valid and data_ready signals are high, the _write_ack() task is called to notify the Python environment that the write is completed. At the same time the data_valid_v variable is cleared to terminate the transfer. 

Note that the synchronous logic is likely very similar to the logic within an RTL implementation of a ready/valid initiator. This is an opportunity, since it means that Cocotb BFMs can leverage existing RTL implementations of interface protocols.


Publishing
Now that we have a ready/valid BFM implemented, what can we do with it? Well, in addition to using it to verify our current design, we can also share it with others that also have ready/valid interfaces on their designs. This is Python, after all, and it's very easy to share Python libraries with others via the PyPi repository (https://pypi.org/).

In order to do this, we need to setup a very basic 'setup.py' script in our project directory that identifies the Python package and related data (BFM RTL) that needs to be distributed. After that, it's a simple matter to publish to PyPi such that another project can make use of the BFM simply by adding rv_bfms to that project's requirements.txt file.

Next Steps
Hopefully the description above shows just how simple it is to setup a Python BFM that can interact at the task level with RTL. You can find the full code for this BFM in the rv_bfms Github repository here: https://github.com/pybfms/rv_bfms.

In my next post, we'll take a look at some more-advanced ways to structure BFMs to increase the overall performance even more, and see some ways for BFMs to add more value in debug.

Meanwhile, I'd be interested to hear what protocols are of high interest in your FOSSi (Free and Open-Source Silicon) projects. I'd be especially interested if you'd like to contribute a task-based Python BFM for one or more of those protocols!


Disclaimer
The views and opinions expressed above are solely those of the author and do not represent those of my employer or any other party.