Showing posts with label Verilator. Show all posts

Saturday, February 8, 2020

Selectively Muting your BFMs to Speed up Simulation


Have you ever had the misfortune to be on the CC list for a "lively" email discussion where you're a stakeholder but only case about the conclusion? You can't simply ignore the traffic, because you do care about the conclusion to the discussion. But, it would be a significant time saver if you could just "tune out" all the discussion and simply be notified when a conclusion is reached.

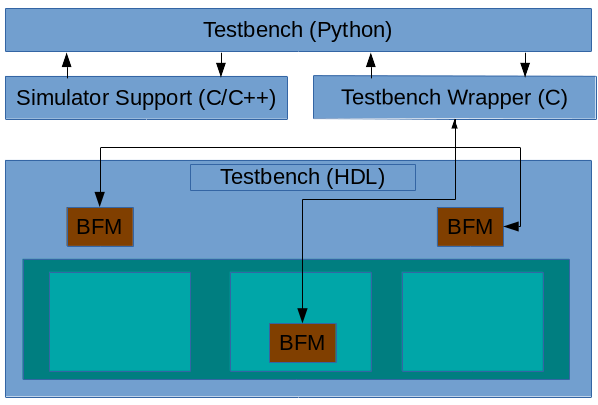
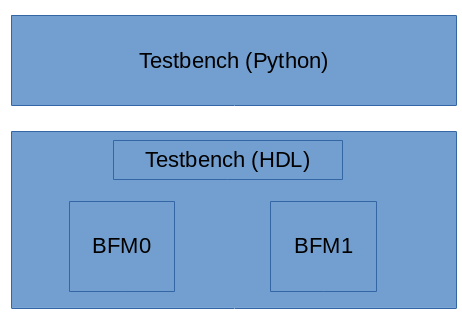
I've been working with Python-based testbench environments (specifically cocotb) since the middle of last year. My first foray into contributing to cocotb was to implement a task-based BFM interface between the HDL environment and the Python environment (related blog posts here and here). The motivation was to increase simulation speed by reducing the number of interactions between the HDL environment and the testbench environment. In other words, allow the Python testbench to "tune out" what was happening in the simulation until the BFM came back with some useful conclusions.

The performance benefits of abstracting up and interacting at the task-call level come from maximizing the amount of time the simulation engine can run before it needs to check in with the testbench environment. Getting good performance also requires having the HDL environment generate clocks for the design, in addition to having Python interact with BFMs at the task level to drive stimulus against the design.

The performance benefits of this approach do vary a bit. If all of your tests interact with the design at the signal level and still only run for a small number of seconds each, then changing the way you interact with the simulation is unlikely to improve performance. A significant percentage of the time in your simulation runs is likely taken up by environment startup, and you might not really care about the run time anyway (what's a few extra seconds, right?)

For tests that run longer, though, the performance benefits can be quite significant. One of my projects is Featherweight RISC (FWRISC), a small RISC-V implementation. One of the Zephyr-OS tests that runs as part of the regression suite tests the ability to synchronize between multiple threads. Unlike the simple unit tests or compliance tests, this test runs for quite a while. Here, we see a pretty significant difference in runtime based on whether we interact with the simulation via signals or BFM tasks.

Scenario 
Time 
Icarus / Signal BFM 
17:06 
Icarus / Task BFM 
1:51 
Verilator / Task BFM 
0:06 

The table above compares running the same test in Icarus Verilog using signal-level interaction and in Icarus Verilog using task-based interaction. Simply switching to task-based interaction reduces the runtime by a factor of 9.2x! Moving from interpreted event-driven simulation to Verilator's two-state cycle-based simulation engine allows us even more speed.

Delegating Decisions to the BFM

This type of performance speed-up is quite nice, especially since the BFMs are quite simple. But, can we do better? In short, the answer is yes. We just need to continue down the path of reducing the number of interactions between simulation and testbench environment.

With task-based BFMs, quite a few decisions are already handled locally. For example, a UART BFM will typically handle the details of transmitting/receiving a byte, allowing the testbench to only interact with the BFM at byte boundaries.

There are cases, however, where a bit more flexibility is required. For example, an AMBA AXI BFM may handle all details of burst and phase timing under normal circumstances. Sometimes, however, the testbench might need to take fine-grained control for testing corner cases. Always interacting at the detail level will hurt performance of the common case. The solution is to have multiple (two in this case) operating modes for the BFM that allow us to have the highest performance for the common case, and fine-grained control (with lower performance) in the cases where this is needed.

Selective Muting Example: FWRISC Tracer 

Featherweight RISC has an execution-trace monitor built it. This is used by most of the regression-suite tests for checking. I've also found it quite helpful in debugging issues above the signal level. For example, when doing initial Zephyr OS bring-up, it was really helpful to be able trace function entry/exit in the log.

The FWRISC monitor issues three types of events:
  • Instruction executed
  • Register write
  • Memory write
Unit tests use all of these events to verify proper operation of the FWRISC core. However, as we move to running higher-level software, many of these events aren't needed. For example, when running Zephyr tests, we're running a not-insignificant amount of software. We definitely don't care to know about every register write. We would only care when debugging the most-obscure of issues! Zephyr can be configured with a buffer-based console, so we do care about some memory writes. However, not the majority. In most cases, we can tell if a test passed from the console output. If, however, we're debugging a test under Zephyr, we might care about function calls. But, we don't need to know about every executed instruction.

Muting Register Writes

The simplest event to disable turns out to be register writes. This is because our level of choice is binary: we only need to enable or disable tracing on register writes.

@cocotb.bfm(hdl={
    bfm_vlog : bfm_hdl_path(__file__, "hdl/fwrisc_tracer_bfm.v"),
    bfm_sv : bfm_hdl_path(__file__, "hdl/fwrisc_tracer_bfm.v")
    })
class FwriscTracerBfm():

    # ...

    @cocotb.bfm_import(cocotb.bfm_uint32_t)
    def set_trace_reg_writes(self, t):
        pass

The Python side of this control is shown above. Specifically, we declare a Python method in the BFM class that will act as a proxy for a task in the SystemVerilog BFM. 

module fwrisc_tracer_bfm(
                input                   clock,
                input                   reset,
                // ...
                );
    reg    trace_reg_writes = 1;

    task set_trace_reg_writes(reg t);
        trace_reg_writes = t;
    endtask

    always @(posedge clock) begin
        if (rd_write && rd_waddr != 0) begin
            if (trace_reg_writes) begin
                reg_write(rd_waddr, rd_wdata);
            end
        end
    end

    // ...

When the user's code calls the set_trace_reg_writes in the Python code, the correspond SystemVerilog task shown above will be called. This very simple task simply update the value of a flag within the BFM that controls whether register-write events are propagated to the testbench. This flag is checked when the BFM detects a register write, and the testbench is notified only if register writes are currently enabled.

Controlling Instruction Tracing
We need a bit more control over how instruction tracing. For unit tests, the testbench wants to be aware of all instructions that are executed. When debugging compliance tests, we want to be aware of all branches. When debugging Zephyr tests, we want to be aware of function calls.

@cocotb.bfm(hdl={
    bfm_vlog : bfm_hdl_path(__file__, "hdl/fwrisc_tracer_bfm.v"),
    bfm_sv : bfm_hdl_path(__file__, "hdl/fwrisc_tracer_bfm.v")
    })
class FwriscTracerBfm():

    @cocotb.bfm_import(cocotb.bfm_uint32_t, cocotb.bfm_uint32_t, cocotb.bfm_uint32_t)
    def set_trace_instr(self, all_instr, jump_instr, call_instr):
        pass

On the Python side, not much difference here. We're simply passing more parameters to the SystemVerilog side that reflect the additional controls we wish to have over being notified when an instruction executes.

module fwrisc_tracer_bfm(
    input  clock,
    input  reset,
    // ...
    );

    // ...

    reg trace_instr_all = 1;
    reg trace_instr_jump = 1;
    reg trace_instr_call = 1;

    task set_trace_instr(reg all, reg jumps, reg calls);
        trace_instr_all = all;
        trace_instr_jump = jumps;
        trace_instr_call = calls;
    endtask

    always @(posedge clock) begin
        if (ivalid) begin
            last_instr <= instr;
  
            if (trace_instr_all 
                || (trace_instr_jump && (
                    last_instr[6:0] == 7'b1101111 || // jal
                    last_instr[6:0] == 7'b1100111))  // jalr
                || (trace_instr_call && (
                    // JAL with a non-zero link target
                    last_instr[6:0] == 7'b1101111 ||
                    last_instr[6:0] == 7'b1100111) && last_instr[11:7] != 5'b0)
               ) begin
                instr_exec(pc, instr);
            end
        end
    end

    // ...

endmodule

The more-interesting part, not surprisingly, is on the SystemVerilog side. The block that recognizes that an instruction has completed now needs to make a few more decisions before determining whether the testbench should be notified. Specifically, we check the last instruction executed to determine whether it was a jump, or whether it was a call. In the RISC-V ISA, the only difference between a jump and a call is that a jump will not specify a link register to store the return address.

Even here, the code isn't too complicated. The BFM also contains code that checks memory-write addresses against a series of user-specified address regions, and only passes on writes that are within one of this regions. I'll omit this code, since you probably get the idea by now...

So, what is the impact? Well, right around 2x in the FWRISC testbench! One of the example applications that comes with Zephyr is an implementation of the Dining Philosophers problem. It's actually a fun test to run because it doesn't just print text, it generates animations! Because this test is multi-threaded, and because it involves time delays, it can be somewhat time-consuming to run in simulation. 

Scenario 
Time 
Verilator / Task BFM (Full) 
1:05 
Verilator / Task BFM (Min) 
0:24 

The table above compares the time needed to run this test with the BFM issuing all events to the testbench (Full), and the time needed when only minimum events are issued (Min). It's hard to ignore an improvement of this magnitude, achieved simply by addition of a little bit of logic in the BFM to allow it to locally make more intelligent choices on whether to notify the testbench of activity. 

You can even see the difference visually in the two videos below. In both cases, the video runs to the same point in the test (same text displayed), and then the video repeats. The video on the left shows a run with the BFM forwarding all events to the testbench. This run takes about 12 seconds to get to the defined point in the test. The video on the right shows a run with the BFM only forwarding key events to the testbench. This run takes about 6 seconds to get to the defined point in the test.
BFM (Full Activity) BFM (Selectively-Muted Activity)


Conclusion
Enabling BFMs to make more decisions locally about when an event is truly of interest to the testbench can have a significant beneficial impact on performance. I've illustrated this technique using Python as a testbench language running in event-driven and cycle-driven simulation engines. However, this approach applies to other testbench languages (eg SystemVerilog) and other execution platforms (eg Emulators, FPGA prototypes). Next time you write a BFM (whether general-purpose or special-purpose), consider what degree of intelligence to embed in the BFM and which categories of events you may want to selectively "mute" in exchange for increased throughput.


Disclaimer
The views and opinions expressed above are solely those of the author and do not represent those of my employer or any other party.

Saturday, November 30, 2019

Adding Task-Based Bus Functional Models to Cocotb


Getting a project started -- even to a certain level of completeness -- is often pretty simple. A couple weekends of hacking often results in pretty good progress and results. Finishing things up, in contrast, is often a slow process. That has certainly been the case with some work I did back in May and June this year to prototype a task-based interface between Python and an HDL simulator. The proof-of-concept work I did at the time seemed quite promising, but the clear next step was to make that work more accessible to others. That "last little bit of work" has certainly turned out to take more time that I had originally assumed!

Just as a reminder, the motivation for interacting with an HDL environment at the task level is quite simple: performance. Communicating across language (especially interpreted language) boundaries tends to be expensive, so minimizing the number of cross-language communications is critical to achieving high throughput. Using a task-based interface between Python and an HDL environment boosts performance in three ways. First, a task-based interface groups data so fewer language-boundary crossings are required to communicate a given amount of data. Secondly, and more importantly, using a task-based interface enables the HDL environment to filter events and only interact with the Python environment when absolutely necessary. Finally, using a task-based interface enables integrations with high(er)-speed environments, such as emulation or the current release of Verilator, where signal-level integration isn't practical.

I started looking at Python as a testbench language for reasons that might initially seem strange: the Python ecosystem (primarily PyPi) that makes it easy to publish bits of library and utility code in a way that it is easily-accessible to others. Often, the ability to take advantage of the work of others is gated by the effort required to gather all the required software dependencies. The Python ecosystem promises to alleviate that challenge, and I was excited to explore the possibilities.

Where Does it Fit?
I'm aware of a few projects that use Python for verification, but it currently appears that Cocotb is the most visible Python-based testbench for doing hardware verification using Python testbench code. Consequently, it made very good sense to see whether the task-based integration I had prototyped could be integrated with the existing Cocotb library.

Cocotb is a Python library that supports light-weight concurrency via co-routines, and provides primitives for coordinating these co-routines with each other and with activity in a HDL simulation environment. In addition to the Python library, Cocotb provides native-compiled C/C++ libraries that integrate with the simulation environment via APIS implemented by the simulator (VPI, DPI, FLI, or VHPI depending on the simulator). Currently, Cocotb interacts with simulation environments at the signal level.

In considering how to add task-based interactions to Cocotb, there were a several requirements that I thought were quite important. First, the user should not be forced to choose between signal-level and task-based interactions between Python and HDL. It should be possible to introduce task-based interactions to a testbench currently interacting at the signal level, or add a few signal-based interactions to a testbench that primarily interacts at the task level. Secondly, a task-based integration must support a range of simulator APIs. I had prototyped a DPI-based integration, which is supported by SystemVerilog simulators, supporting Verilog and VHDL simulators as well was clearly important. Finally, achieving good performance was a key requirement, since performance is the primary motivation for using a task-based interface in the first place.

Task-Based BFM Cocotb Architecture


From a system perspective, the diagram above captures how task-based BFMs integrate with Cocotb. Each BFM instance is represented in the HDL environment by an instance of an HDL module. This module is special, in that it knows how to accept and make task calls and convert between signal-level information and those task calls.

Each BFM also knows how to register itself with a BFM Manager within Cocotb. When the HDL portion of a BFM registers with Cocotb, the BFM Manager creates an instance of a Python class that represents the BFM within the Python environment.

The BFM Manager provides methods to allow the user's test code to query the available BFMs and obtain a handle to the BFM instances required by the test. From there, the user's test simply calls methods on the Python class object and/or receives callbacks.

Task-Based BFM Architecture

Let's take a quick look at the work needed to support a task-based BFM. First off, the BFM author needs to a Python class to implement the Python side of the BFM. That class is decorated with a @cocotb.bfm decorator that associates HDL template files with the BFM class. Below is a BFM for a simple ready/valid protocol.

@cocotb.bfm(hdl={
    cocotb.bfm_vlog : cocotb.bfm_hdl_path(__file__,   "hdl/rv_data_out_bfm.v"),
    cocotb.bfm_sv   : cocotb.bfm_hdl_path(__file__, "hdl/rv_data_out_bfm.v")
})
class ReadyValidDataOutBFM():
    # ...


Next, the BFM author must specify the low-level interaction API with the HDL BFM. All calls must be non-blocking, so most interactions with the HDL environment are implemented as a request/acknowledge pair of API calls.

    @cocotb.bfm_import(cocotb.bfm_uint32_t)
    def write_req(self, d):
        pass
    
    @cocotb.bfm_export()
    def write_ack(self):
        self.ack_ev.set()

Calling a class methods decorated with @cocotb.bfm_import will result in a task call in the HDL BFM. Class methods decorated with @cocotb.bfm_export can be called from the HDL BFM.

Finally, on the Python side, the BFM author will likely provide a convenience API to simplify the testwriter's life:

    @cocotb.coroutine
    def write_c(self, data):
        '''
        Writes the specified data word to the interface
        '''
        
        yield self.busy.acquire()
        self.write_req(data)

        # Wait for acknowledge of the transfer
        yield self.ack_ev.wait()
        self.ack_ev.clear()

        self.busy.release()


There's one piece left, and that's the HDL BFM. This is specified as a template:

module rv_data_out_bfm #(
parameter DATA_WIDTH = 8
) (
input clock,
input reset,
output reg[DATA_WIDTH-1:0] data,
output reg data_valid,
input data_ready
);
reg[DATA_WIDTH-1:0] data_v = 0;
reg data_valid_v = 0;
always @(posedge clock) begin
if (reset) begin
data_valid <= 0;
data <= 0;
end else begin
if (data_valid_v) begin
data_valid <= 1;
data <= data_v;
data_valid_v = 0;
end
if (data_valid && data_ready) begin
write_ack();

if (!data_valid_v) begin
data_valid <= 0;
end
end
end
end
task write_req(reg[63:0] d);
begin
data_v = d;
data_valid_v = 1;
end
endtask

// Auto-generated code to implement the BFM API
${cocotb_bfm_api_impl}

endmodule

The BFM author must implement tasks that will be called from the Python class. Task proxies that will invoke Python methods are implemented by the Cocotb automation, and substituted into the template where the ${cocotb_bfm_api_impl} tag is specified.

Current Integrations
Currently, task-based BFM integrations are implemented for Verilog via the VPI interface and for SystemVerilog via the DPI interface. A VHDL integration isn't currently supported, but that's on the roadmap. One complication with VHDL is that there are actually several interfaces that may need to be supported depending on the simulator -- VHPI, VHPI via VPI, Modelsim FLI. Here I could use some input from the community on priorities, so I'd definitely like to hear from you if you're using Cocotb with VHDL...

Results
As I mentioned at the beginning of this post, performance is the primary reason for using task-based interaction between Python and a HDL environment. So, how much improvement can you expect? Well, that entirely depends on how frequently your tests interact with the HDL environment and, to a certain extent, on how long your tests are. If your testbench needs to interact with the testbench every clock cycle, then you're unlikely to see much benefit. If, however, your testbench spends quite a few cycles waiting for the design to respond, then you're likely to see pretty significant benefits.

I'll use my FWRISC (Featherweight RISC) RISCV core as an example. In this environment, the bulk of the test is actually compiled code that executes on the processor. The Python testbench is primarily responsible for checking results and providing debug information when needed.
A diagram of the simulation-based testbench is shown above. The Tracer BFM is responsible for monitoring execution of the FWRISC core and sending events up to the high-level testbench as needed. These events include:
  • Instruction executed
  • Register written
  • Memory written
I've created two Cocotb implementations of this BFM: one that interacts at the signal level, and one that interacts at the task level. To compare the performance, I'm running a Zephyr test with Icarus Verilog for 10ms of simulation time.

Let's start with as close to a direct comparison as possible. Both the signal-level and task-based BFM will capture the same information and propagate it to the Python testbench.
  • Signal-Level BFM: 85s (wallclock)
  • Task-Level BFM: 33s (wallclock)
Okay, so already we're looking pretty good. This performance increase is simply because the task-based BFM doesn't need to call the Python environment every cycle. 

Another way we can benefit is to use a higher-performance simulator. Icarus Verilog is interpreted, and supports a full event-driven simulation environment. Verilator has a much more restricted set of features (synthesizable Verilog only, limited signal-level access, etc), but is also much faster. It also doesn't currently support the signal-level access to the extent necessary to do a direct comparison between a task-based BFM and a signal-level BFM. So, how do we look here? I actually had to increase the simulation time to 100ms (10x longer) to get a meaningful reading.
  • Task-Level BFM: 18s (wallclock)
So, coupling a fast execution platform with an efficient integration mechanism definitely brings benefits!

Next Steps
So, where do we go from here? Well, please stay tuned for my next blog post to get more details on how create task-based BFMs using these features. I also have an active pull request (#1217) to get this support merged into Cocotb directly. Until then, you can always access the code here


Disclaimer
The views and opinions expressed above are solely those of the author and do not represent those of my employer or any other party.

Saturday, June 8, 2019

Py-HPI: A Procedural HDL/Python Integration


As I mentioned in my last post, I've been looking at using Python for more tasks, including functional verification. My go-to languages for functional verification have traditionally been SystemVerilog for professional work, and C++ when I'm working on a personal project. I've started doing more of my small-application development in Python (often as an alternative to C++), and have wondered whether I could also migrate my testbench development from C++ to Python as well.

This blog post provides an introduction to an integration I created between Python and an hardware descriptin language (HDL) simulation environment called Py-HPI (for Python HDL Procedural Interface). I'm far from the first to create an integration between Python and an HDL simulator (I'm aware of at least one formal project, and several others users that have written about their integration work), so what is different about Py-HPI?

Well, two things, really in my opinion: 
  • Py-HPI integrates at the procedural level, which means Python can directly call tasks in the HDL environment instead of interacting with signals in the HDL environment. 
  • Py-HPI provides a high degree of automation for setting up this procedural-level integration.
In this blog post, I will be describing the user experience in using Py-HPI. In future blog posts, I'll walk through how Py-HPI integrates on my go-to project for playing with verification technologies, and I'll go more in-depth on how Bus Functional Models (BFMs) and testbench environments are developed for Py-HPI.

Py-HPI: The Big Picture


The structure of a Py-HPI enabled testbench is shown above. The key elements are described below
  • Testbench (Python) -- This is Python code the user writes to interact with the design running within the HDL simulation environment
  • Simulator Support -- This is C/C++ code generated by Py-HPI that implements the integration with a specific type of simulator. In general, this code is independent of the specific testbench
  • Testbench Wrapper -- This is C code generated by Py-HPI that implements the testbench specifics of the integration between Python and the HDL environment
  • Bus Functional Models (BFMs) -- BFMs written in HDL (eg SystemVerilog) implement the translation between task calls and signal activity and vice versa.
Currently, Py-HPI supports standard SystemVerilog-DPI simulators (eg Modelsim) as well as Verilator. More integrations are planned, including support for Verilog simulators like Icarus Verilog.

Py-HPI: A Small Example


One easy way to get a sense for the user experience when using Py-HPI is to walk through the steps to run a very simple testbench environment. One of the Py-HPI examples provides just such a testbench.
The structure of this testbench environment is shown above. The Python portion of the testbench drives the SystemVerilog HDL testbench via two bus functional models that are instanced in the SystemVerilog environment.

Python Testbench

First, let's take a look at the Python testbench code, which you can find here:
def thread_func_1():
  print("thread_func_1")
  my_bfm = hpi.rgy.bfm_list[0]
  for i in range(1000):
    my_bfm.xfer(i*2)

def thread_func_2():
  print("thread_func_2")
  my_bfm = hpi.rgy.bfm_list[1]
  for i in range(1000):
    my_bfm.xfer(i)

@hpi.entry
def run_my_tb():
    print("run_my_tb - bfms: " + str(len(hpi.rgy.bfm_list)))

    with hpi.fork() as f:
      f.task(lambda: thread_func_1());
      f.task(lambda: thread_func_2());

    print("end of run_my_tb");
Execution starts in the run_my_tb()method (which is marked by a special Python decorator hpi.entry, to identify it as a valid entry point) which starts two threads and waits for them to complete. Each of the thread methods (thread_func_1 and thread_func_2) obtain a handle to one of the BFM instances and call the BFM's API to perform data transfers in the SystemVerilog testbench environment.
In a way, it's almost identical to what I would write in either C++ or SystemVerilog. In a way, that's kind of the point from my perspective.

Running the Testbench

Okay, now that we know what the Python side of the testbench looks like, let's see the commands used to create and compile the files necessary to run a simulation. These commands are in the runit_vl.sh script inside the example directory. In this case, I'll show the commands required to run Py-HPI with the Verilator simulator. The example also provides a script (runit_ms.vl) that runs the same example with Modelsim.

Create the Simulation Support Files

We first need to create the simulation-support files. Since we're targeting the Verilator simulator, we need to run the 'gen-launcher-vl' subcommand implemented by the Py-HPI library.
python3 -m hpi gen-launcher-vl top -clk clk=1ns
Verilator is a bit of an outlier, in that the simulation-support files are specific to the HDL design being simulated. Consequently, we need to specify the name of the top Verilog module and the clock name and period.

Create the Testbench Wrapper

Now, we need to create the Testbench wrapper file that will support the specific BFMs instantiated inside the testbench. 
python3 -m hpi -m my_tb gen-bfm-wrapper simple_bfm -type sv-dpi
python3 -m hpi -m my_tb gen-dpi

Because the Verilator simulator supports DPI, we generate a DPI-based testbench wrapper for our testbench that uses a single BFM. The resulting testbench wrapper is implemented in C and provides the connection between SystemVerilog and Python for our BFM.

Compile Everything

This step is very specific to the simulator being used. 
# Query required compilation/linker flags from Python
CFLAGS="${CFLAGS} `python3-config --cflags`"
LDFLAGS="${LDFLAGS} `python3-config --ldflags`"

verilator --cc --exe -Wno-fatal --trace \
 top.sv simple_bfm.sv \
 launcher_vl.cpp pyhpi_dpi.c \
 -CFLAGS "${CFLAGS}" -LDFLAGS "${LDFLAGS}"

make -C obj_dir -f Vtop.mk
Since we're using Verilator, we need to run Verilator to compile the HDL files and the simulator-support and testbench wrapper C/C++ files. Verilator generates C++ source and a Makefile to build the final simulator image. Our last step is to build the Verilator simulation image using the Verilator-created Makefile.

Run it!

Finally, we can run our simulation.
./obj_dir/Vtop +hpi.load=my_tb +vl.timeout=1ms +vl.trace
We pass a few additional plusargs to enable specific behavior:

  • The +hpi.load=my_tb specifies the Python module to load
  • The +vl.timeout=1ms specifies that the simulation should run for a maximum of 1ms. Other simulators will, of course, provide different mechanisms for doing this
  • The +vl.trace argument specifies that waveforms should be created. Other simulators will provide different ways of turning on tracing.
So, all in all, Py-HPI makes it quite easy to connect a Python testbench to an HDL simulator at the procedural level.

Conclusion

In this blog post, I introduced Py-HPI, a procedural interface between Python and an HDL testbench environment along with an overview of the user experience when creating and running a testbench with Py-HPI. In my next post, I'll look at a Py-HPI testbench for my FWRISC RISC-V core and compare the new Python testbench with the existing C++ testbench. Until then, feel free to check out the Py-HPI library on GitHub (https://github.com/fvutils/py-hpi) and I'd be interested to hear your experiences in using Python for functional verification.


Disclaimer
The views and opinions expressed above are solely those of the author and do not represent those of my employer or any other party.


Saturday, December 15, 2018

FWRISC: Creating a Unit-test Safety Net


When developing software, I've become very comfortable with test-driven development -- a methodology that calls for tests to be developed along with, or even before, functionality. It's quite common for me to develop a test first, which obviously fails initially, and implement functionality until the test passes.
I have typically approached hardware verification from a very different perspective. When doing verification, I've typically started with a hardware block that is largely functional, or at least is believed to be largely functional. My work then begins with test plan development and some detective work to ferret out the potentially-problematic areas of the design that require targeted tests.

When developing the FWRISC RISC-V core, I initially started off taking a verification approach. One of the requirements for the RISC-V contest was that cores must pass the RISC-V Compliance Tests. So, I started off by attempting to run one of the compliance tests. I quickly realized that there were some challenges with this approach:
  • Even for testing a simple feature, the RISC-V compliance tests are quite complicated. All involve exception instructions. All involve multiple instructions that are unrelated to the instruction that is ostensibly the target of the test. This isn't uncommon for verification, of course.
  • Taking a verification approach early in the development cycle means that debugging is incredibly painful. Tracking down a small issue with the core by looking at the test result of a test that consists of a hundred or so instructions is incredibly painful -- just see the waveform at the top of this blog post which comes from the test for the 'add' instruction.
  • In contrast, see the following waveform that shows the entire 'add' unit test. While it's longer than a single instruction, this test consists of a total of 6 instructions. This means that there's much less to look at when a problem needs to be debugged.


Creating a Testbench

My verification background is SystemVerilog and UVM, so one early complication I faced when developing tests for the Featherweight RISC core was that the RISC-V soft-core context explicitly required the use of Verilator as a simulator. Verilator is, in some senses, a simulator for the synthesizable subset of SystemVerilog. In other senses, it's a Verilog to C++ translator that can be used as to create a C++ version of a synthesizable Verilog description to bind in to a C++ program. Compared to a simulator, think of it, not as a house, but as a pile of lumber, tools, and a blueprint from which you can build a house (which, by the way, is in no way an attempt to minimize the value of Verilator -- just point out some of the required legwork). 

The fact that Verilator produces a C++ model of the SystemVerilog RTL brought to mind the unit-testing library that I invariably use when testing C++ code. Googletest is a very handy library for organizing and executing a suite of C++ unit tests:
      • Collects and categorizes tests
      • Enables common functionality to be centralized across tests
      • Provides result-checking macros/assertions
      • Executes an entire test suite, a subset, or a single test
      • Reports test status
In addition to using Googletest for standard C++ applications, I had used the Googletest framework to manage some early device firmware written in C when testing it against Verilog RTL being verified in a UVM testbench. This approach seemed close enough to what I was looking to do with Featherweight RISC and Verilator that I ended up extending that project (named googletest-hdl) to support Verilator. While the contest required the use of Verilator, I wanted to setup my basic test suite such that it could run with other simulators. Since the googletest-hdl project already supported running with SystemVerilog and UVM, I was covered there.

The Featherweight RISC testbench block diagram is shown below:


The design is instantiated in the HDL portion of the testbench. This testbench portion will run in Verilator or another Verilog simulator. The Googletest portion of the testbench contains the test suite and code needed to check test results. There are two points at which the environments communicate: the run-control path by which the Googletest environment instructs the HDL environment to run, and the tracer API path by which events are sent from the processor to the testbench environment.
The tracer API path is the key to checking test results. The following events are sent to the Googletest environment as SystemVerilog DPI calls:
  • Instruction-execution event
  • Register-write event
  • Data-access event
Now that we have this testbench structure, we can create some tests.

Creating Tests

When it comes to unit tests, I usually find that the initial test structure is successively refined as I discover more and more commonality between the tests. Frankly, the ideal unit test is almost-entirely data driven, and the Featherweight RISC tests are very close to this ideal.

The unique aspects of the instruction unit tests are stored in the test files themselves. Here is test for the add instruction:


  • Note the instruction sequence to load registers with literals and perform the 'add'. This is the actual test.
  • The data between 'start_expected' and 'end_expected' contains the registers that are expected to be written. The test harness will read this data from the compiled test.
This data-driven test allows our test harness to be fairly simple and completely data driven, as shown below:

  • First, the test harness executes the simulation by calling GoogletestHdl::run()
  • Next, the test harness reads in the compiled test file, which has been specified with the +SW_IMAGE=<path> option
  • The start_expected..end_expected range is located and read in
  • Finally, the register contents are checked against the expected values specified in the test.

Results

After getting the unit-test structure in place, I almost-literally went down the list of RISC-V RV32I instructions and created a test for each as I implemented the instruction. The completed tests provided a nice safety net for catching issues introduced as new instructions were implemented, and as bugs were corrected. More issues were found as the RISC-V compliance tests were brought up and these issues prompted creation of new unit tests. 
The unit-test safety net has been incredibly helpful in quickly identifying regressions in the processor implementation, and helping to identify exactly which instructions are impacted. The unit-test experience also got me thinking about formal verification, and whether this could also be used as a form of unit-test suite. I'm getting ready to take another pass at shrinking the area required for the Featherweight RISC-V, and am thinking about creating a Formal unit-test suite to help in catching bugs introduced by that work. I'll talk about those experiments in a future post.
For now, I have a suite of 67 unit tests and 55 RISC-V compliance tests that provide a very good safety net to catch regressions in the Featherweight RISC implementation.

Disclaimer


The views and opinions expressed above are solely those of the author and do not represent those of my employer or any other party.