Showing posts with label functional coverage. Show all posts

Sunday, July 17, 2022

PyUCIS: Manipulating Coverage Data


In a prior post, we looked at how to inspect coverage as a text report and export coverage data using the PyVSC API, and view coverage graphically using the PyUCIS-Viewer. Recent enhancements have enabled the PyUCIS library to provide even more ways to manipulate coverage data. Over the next couple of posts, we’ll look at those enhancements. 

New ‘ucis’ Command

PyUCIS is a library for working with the Accellera UCIS data model. It started as a library for other applications and libraries, such as PyVSC and the PyUCIS Viewer, to use to read and write data using the UCIS data model. Recent enhancements have added standalone functionality which can meaningfully be accessed from the command line. 

You can find documentation for the ucis command and sub-commands in the PyUCIS documentation. Fundamentally, there are four key operations:

  • Convert coverage data from one format to another
  • Merge coverage data from multiple databases into a single database
  • Produce coverage reports in various formats
  • Obtain information about available coverage data and report formats

These commands are just a starting point. They will be enhanced over time, and more commands may be added as well. If you have suggestions for new commands and/or new capabilities for existing commands, feel free to add an enhancement request on the PyUCIS GitHub page.

Plug-in Framework

PyUCIS has added a plug-in framework with support for database formats and report formats. The goal is to make commands operating on coverage data extensible extensible from the beginning, as well as to enable the set of supported coverage-data formats and report formats to be easily extended without changing PyUCIS.  I’ll devote a future post to the plug-in framework. For now, the ucis command supports listing the available coverage-data and report plug-ins. For example:

% ucis list-db-formats

libucis - Reads coverage data via an implementation of the UCIS C API

xml     - Supports reading and writing UCIS XML interchange

yaml    - Reads coverage data from a YAML file


New Input Format

One often-requested PyUCIS feature is the ability to merge coverage data from several input coverage databases into a single resulting coverage database. One of the first challenges I faced in implementing this functionality was how to write tests. The UCIS API is written with applications in mind. I’ve found it to be a pretty-verbose API when it comes to writing tests. Consequently, tests written directly in terms of the API aren’t particularly easy to follow from a code perspective.

I decided to define a YAML format to make it simpler to capture coverage data in an easy-to -read way. Initially, this was just for testing. However, it may also be a useful interchange format that is less verbose and complex (also, quite possibly, more simplistic) that the XML interchange format defined by the UCIS standard.


A simple coverage specification is shown above. This coverage data describes a covergroup type (my_cvg) with a single instance (i1). A single coverpoint (cp1) has two bins (b1, b2) of which one has a single hit and one has no hits. While this coverage specification was created to make setting of test coverage data simpler for a human, I believe it may also be useful as a simple coverage-interchange format. If you find it useful, please let the community know via the Discussion forum on the PyUCIS GitHub page.

You can find more details on the YAML Coverage Data Format reference documentation page. 

Merging Coverage Data

One consistently-requested feature for PyUCIS is the ability to merge multiple databases into a single unified coverage database. PyUCIS now supports basic merge functionality. Currently, PyUCIS performs a union merge where all unique coverage features found in all the input databases are propagated to the output database. I anticipate that more merge algorithms will need to be added over time, but hopefully this is a good start.


Let’s take a look at a very simple case. Let’s say we have two coverage-data sets shown below:


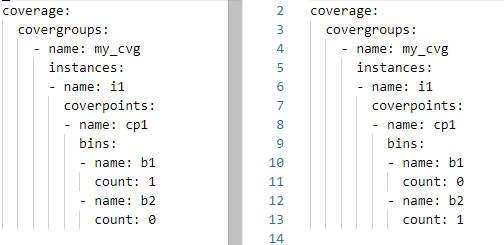
The structure of these two coverage databases is the same (same covergroup type, instance, and coverpoint). Each coverage database has 50% coverage. Let’s merge these two databases and report the coverage.

% ucis merge -if yaml -o merge.xml coverage_1.ycdb coverage_2.ycdb

We specify the two input databases, as well as their format (yaml). We specify the output database as merge.xml.

The resulting coverage report on the merged database will report 100% coverage, as expected:

% ucis report merge.xml

TYPE i1 : 100.000000%

    CVP cp1 : 100.000000%

Reporting Coverage Data

Reporting is a key activity when working with coverage data. We’ve looked at the ability to browse coverage data graphically using the PyUCIS-Viewer, but getting a textual report is every bit as important. In addition to presenting information concisely, textual reports can be processed programmatically to extract key pieces of data. 

We can list the currently-available report plugins using the ucis command:

% ucis list-rpt-formats

json - Produces a machine-readable JSON coverage report

txt  - Produces a human-readable textual coverage report


The default report is textual. Let’s create a textual report on the YAML coverage-data above:

% ucis report -if yaml coverage.ycdb 


Note that we need to specify the format of the input data (yaml). The result is a simple human-readable report of the coverage data in the database.

What if we wanted to post-process the data using a script? We certainly could extract what we need by parsing the output above, but working with data in a machine-readable format is often much simpler. Let’s report our data in JSON format:

% ucis report -if yaml -of json coverage.ycdb 

Obviously, the data is less compact and more verbose. But, reading this into a Python script for further post-processing is incredibly simple! If you’re interested in the JSON report format, have a look at the schema documentation <https://pyucis.readthedocs.io/en/latest/reference/coverage_report_json.html>.

So, for now, PyUCIS supports two textual report formats, and would benefit from more report formats. For example, a plain HTML report and a fancy interactive web-based report. If someone in the community has the skills and is interested, the project would definitely be interested!

Next Steps

PyUCIS continues to evolve, adding a more more hopefully-useful features at a time. Stay tuned for a future post on the plug-in interface, and the addition of more coverage-database and report formats. 


Copyright 2022 Matthew Ballance

The views and opinions expressed above are solely those of the author and do not represent those of my employer or any other party.

Sunday, June 12, 2022

PyVSC: Working with Coverage Data


I’ve been investing some time in documentation updates this weekend, after a couple of PyVSC users pointed out some under-described aspects of the PyVSC coverage flow. Given that these areas were under-documented in the past, it seemed a good opportunity to highlight what can be done with functional coverage data once it is sampled by a PyVSC covergroup.

So, we’ve described some functional coverage goals using a PyVSC covergroup and coverpoints, created a covergroup instance, and sampled some coverage data – perhaps it was randomly-generated stimulus or data sampled from a monitor. What now?

Runtime Coverage API

One simple thing we can do is to query coverage achieved using the coverage APIs implemented by PyVSC covergroup classes. The `get_coverage` method returns the coverage achieved by all instances of a covergroup type. The `get_inst_coverage` method returns the coverage achieved by the specified covergroup instance.

Let’s look at an example:


In the example above, we define a covergroup with a coverpoint that contains four bins (1, 2, 4, 8). We create two instances of this covergroup and sample them with two different values. After each call to sample, we display the coverage achieved by all instances of the covergroup (type coverage) and the coverage achieved by each instance.


The output from this example is shown above. After sampling the first covergroup, the coverage achieved for that, and all, instances is 25% since one of four bins was hit. After sampling the second covergroup, the coverage achieved for that covergroup instance is also 25%. Because two different bins are hit between the two covergroup instances, two of four bins are hit (50%) for type coverage.


Runtime Coverage Reports

Another way to look at collected coverage is via a coverage report. PyVSC provides two methods that are nearly identical for obtaining a textual coverage report:

  • get_coverage_report – Returns the report as a string
  • report_coverage – Writes the report to a string (stdout by default)

Both of these methods accept a keyword parameter named ‘details’ which controls whether bin hits are reported or just the top-level coverage achieved. Let’s look at a derivative of the first example to better understand the textual coverage report options.


This example is nearly identical to the first one, but with calls to ‘report_coverage’ instead of calls to the covergroup get_coverage methods.


The output from running this example is shown above. When reporting ‘details’ is enabled, the content of each coverage bin is reported. When reporting ‘details’ is disabled, only the top-level coverage achieved is reported. Displaying a coverage report with details is often helpful for confirming the correctness of a coverage model during development.


Saving Coverage Data

The PyUCIS library implements a Python interface to coverage data via the Accellera UCIS data model. It implements an object-oriented interface to coverage data, in addition to the Python equivalent of the UCIS C API. PyVSC uses the PyUCIS library to save coverage data, and can do so in a couple of interesting ways. Coverage data is written via the vsc.write_coverage_db method.

PyVSC can save coverage data to the XML interchange format defined by the UCIS standard. This is the default operation model for write_coverage_db. The example below shows saving it to a file named  ‘cov.xml’. 


PyVSC can also save coverage data to a custom database format, provided the tool that implements that database implements the UCIS C API. The example below saves coverage data to a custom database using the UCIS C API implemented in the shared library named ‘libucis.so’.


Both of these paths to saving coverage may provide ways to bring coverage data collected by PyVSC into coverage-analysis flows implemented by commercial EDA tools. Check your tool’s documentation and/or check with your application engineer to understand which options may be available. Feel free to report what works for you on the PyVSC discussion forum so that others can benefit as well.

Viewing Coverage Data

Obviously, you can use commercial EDA tools to view coverage data from PyVSC if your tool provides a path to bring UCIS XML in, or if it implements the UCIS C API. PyUCIS Viewer provides a very simple open-source graphical application for viewing coverage in UCIS XML format. 

To use PyUCIS Viewer, save coverage data in UCIS XML interchange format, then run PyUICIS Viewer on that XML file:

% pyucis-viewer cov.xml

A simple tree-based graphical viewer will open to show type and instance coverage. 


Conclusion

There are several options for viewing and manipulating coverage once it has been collected via a covergroup modeled with PyVSC. In a future post, we’ll look at some additional manipulation and reporting options being implemented within PyUCIS

Until then, check out the latest additions to the PyVSC documentation and raise questions and issues on the PyVSC GitHub page.


Copyright 2022 Matthew Ballance

The views and opinions expressed above are solely those of the author and do not represent those of my employer or any other party.


Saturday, April 25, 2020

Python Verification: Working with Coverage Data


Before jumping into this week's post, I wanted to offer a bit of an apology to my readers. I recently realized that, despite being a Google property, Blogger only notifies authors of comments for moderation if the author has specifically registered a 'moderator' email with the site. So, apologies to those of you that have commented on posts directly on the Blogger site and watched those comments hang out in limbo indefinitely. I should now receive notifications of new comments.

In my last post, we looked at modeling and sampling functional coverage in Python using the Python Verification Stimulus and Coverage (PyVSC). In that post, I showed how a textual coverage report could be generated to the console by calling an API. But, there is much more that we want to do with functional coverage data. The key question is: how do we store and manipulate it?

Storing Coverage Data

There are two big motivations for storing coverage data. The first is that we often wish to aggregate coverage across a large number of tool runs. In order to do that, we need a way to persist the coverage data collected by each individual tool run. The second is that we want to run analysis on the collected and aggregated coverage data. We want a way to browse through the data interactively, and create nice-looking reports and charts.

Standard Coverage Models

Storing coverage data isn't much different than storing any other data. The first big question to answer is whether there is a standard way of of representing the data, or whether we need to invent one. While I've certainly had fun in the past inventing new formats for representing and storing data, considering all the requirements and designing in appropriate features to represent all the key features of a given type of data is a time consuming problem. Certainly something that should be undertaken as a last resort.

The good news is that there are several existing formats for representing coverage. The bad news is that the vast majority are focused on representing code coverage data (eg Coburtura), not functional coverage data. That said, there is one industry standard for representing functional coverage and code coverage: Accellera Unified Coverage Interoperability Standard

While the  UCIS defines several things, it doesn't define a standard database format. That said, what it does define is very useful. Specifically it defines:
  • A data model for representing functional coverage, code coverage, and assertion coverage
  • A C-style API for accessing and modifying this data model
  • An XML interchange format to assist in moving data from one database implementation to another. In a pinch, the XML interchange format can even be used as a very simplistic database.
Design is tough, so it's almost always most efficient to make use of the work of a committee of smart and capable people instead of starting over. UCIS is certainly not perfect. There are some "bugs" in the spec, and some internal inconsistencies. That said, it's far better than starting with a blank sheet of paper. The next challenge was adapting UCIS to Python.

PyUCIS Library

Much of my work recently has been in Python, so I wanted a way to work with the UCIS data model in Python. The PyUCIS library is a pure-Python library for working with the UCIS data model. A block diagram of the architecture is shown below. 


Front-End API

The core of the PyUCIS library is an implementation of the UCIS API. Remember that the API defined by the UCIS is a C-style API, while Python is much more object-oriented. I initially decided to implement just an object-oriented version of the UCIS API, but then realized that reusing existing code snippets written in C would be much harder without an implementation of the C-style API. Fortunately, building a C-style compatibility API on top of the object-oriented one was fairly straightforward.

Backend

The PyUCIS library uses a back-end to store the data being accessed via the front-end API. The PyUCIS library currently implements two back ends: an in-memory back-end, and an interface to existing C-API implementations of the UCIS API.

The in-memory back-end stores coverage data in Python data structures. While it's not possible to persist the data model directly, the contents can be saved to and restored from the XML interchange format specified by the UCIS.

The C-library back-end uses the Python ctypes library to call the UCIS C API as implemented by a tool-specific shared library. This allows PyUCIS to access data in databases implemented by tools that support UCIS.

While PyUCIS doesn't currently implement its own native database for storing coverage data, it's likely that it will in the future. Fortunately, Python provides an SQLite database as part of the core interpreter installation. Stay tuned here.

Built-in Apps

The final part of the PyUCIS library are a set of built-in apps. These are used to perform simple manipulations on the coverage data and create outputs. Currently, PyUCIS only contains one built-in app: reading and writing the UCIS XML interchange format. That said, there are a couple planned on the roadmap:
  • A merge app to combine data from multiple UCIS data models
  • A report app to produce a textual or HTML coverage report

PyUCIS Apps

The top layer of the PyUCIS architecture diagram are external applications that use the PyUCIS API. At the moment, there is only one and it's a proof of concept. PyUCIS Viewer is a Python Qt5-based GUI for viewing coverage data.


While the viewer is certainly primitive (and incomplete) at the moment, hopefully this provides some ideas for what can be done with the data accessed via the PyUCIS API.

Next Steps

PyUCIS is a pretty early-stage tool. I'm using it to save coverage data from the PyVSC library, and to produce some simple text coverage reports, but there's still quite a bit to do. As always, if you'd like to contribute to this or other projects, I'd welcome the help. 
In the next post, I'll return the Python Verification Stimulus and Coverage (PyVSC) library to look at modeling constrained-random stimulus. Until then, stay safe!

Disclaimer
The views and opinions expressed above are solely those of the author and do not represent those of my employer or any other party.

Saturday, April 11, 2020

Python Verification Stimulus and Coverage: Functional Coverage


In my last two posts (here and here), I've been talking about modeling random stimulus, constraints, and functional coverage in Python. After looking at the fundamentals of capturing the specifics of data types such that they can be used for hardware verification last week, lets look at using those data types for modeling functional coverage.

As I mentioned last week, I'm using this series of blog posts as a guide and as motivation to document the PyVSC package that implements the random stimulus and coverage that I'm describing. You can find documentation on the functional-coverage features in the Coverage chapter of the documentation on readthedocs.org.

Covergroups

SystemVerilog, as well as several other verification languages, groups functional coverage elements in a construct called a covergroup. A covergroup is a type (like a class) that can be instanced multiple times, and whose instances maintain a relationship back to the type. 

A PyVSC covergroup is a Python class with a special covergroup decorator. 

 @vsc.covergroup
 class my_covergroup(object):

     def __init__(self):
         self.with_sample(
             a=bit_t(4)
             )
         self.cp1 = vsc.coverpoint(self.a, bins={
             "a" : vsc.bin(1, 2, 4),
             "b" : vsc.bin(8, [12,15])
             })

my_cg_1 = my_covergroup()
my_cg_2 = my_covergroup()

The covergroup decorator ensures that core methods and attributes are present in the covergroup class without requiring the class to derive from a specific base class. The decorator also ensures that certain introspection and class-construction steps are performed after the user's constructor code runs and before returning to the caller. Fortunately, all these details are hidden so a PyVSC covergroup behaves like any other Python class. Creating an instance of a covergroup is as simple as creating an instance of the class, as shown above.

Coverpoints, Bins, and Crosses

Once we have a covergroup type defined, we need to define the values, value ranges, and combinations of values we wish to observe during verification. These features are captured by coverpoints, bins, and coverpoint crosses.

All of these features are captured by calling PyVSC methods.
@vsc.covergroup
 class my_covergroup(object):

     def __init__(self, a : callable):

         self.cp1 = vsc.coverpoint(a, bins={
             "a" : vsc.bin(1, 2, 4),
             "b" : vsc.bin(8, [12,15])
             })
For example, above we create a single coverpoint with two bins. The first bin ("a") will be considered covered if the coverpoint sees a value of 1, 2, or 4. The second will be considered covered if the coverpoint sees a value of 8, or 12..15.
@vsc.covergroup
 class my_covergroup(object):

     def __init__(self, a : callable):

         self.cp1 = vsc.coverpoint(a, bins={
             "a" : vsc.bin_array([], 1, 2, 4),
             "b" : vsc.bin_array([4], [8,16])
             })
Creating arrays of bins is also important, of course. In the example above, we create two arrays of bins. The bin array labeled "a" will consist of three individual bins that, respectively, monitor the values 1, 2, and 4. The second bin array ("b") will consist of four individual bins that monitor the values 8..16. In this case, each bin will monitor two coverpoint values (8..9, 9..10, etc). If you're familiar with SystemVerilog, these features -- and even the syntax -- should look very familiar.

One question, of course, is how we associate a name with our coverpoints. If you've used verification frameworks that are embedded in C++ (eg SystemC, or SystemC SCV), you're probably used to specifying strings to name each element. One nice aspect of Python is that we're able to introspect the names of the variables to which features like coverpoints are assigned. So, part of the "magic" that our coverpoint decorator applies is to determine the names of coverpoints based on the class attributes to which coverpoints are assigned.

We don't just care about individual variable values, of course. We often need to ensure that combinations of variable values are exercised as part of verification. That's where coverpoint crosses come into play.
@vsc.covergroup
class my_covergroup(object):

    def __init__(self):
        self.with_sample(
            a=bit_t(4),
            b=bit_t(4)
        )
        self.cp1 = vsc.coverpoint(self.a, bins={
            "a" : vsc.bin_array([], [1,15])
            })
        self.cp2 = vsc.coverpoint(self.b, bins={
            "a" : vsc.bin_array([], [1,15])
            })

        self.cp1X2 = vsc.cross([self.cp1, self.cp2])
Using the cross method, we can create a cross between two existing coverpoints. In the example above, we have created a cross that has 225 cross bins.

Sampling Coverage Data

One topic that we haven't yet looked at is how we will get the data to be sampled from the testbench to the covergroup for the PyVSC library to sample. PyVSC, like SystemVerilog, provides a sample method on the covergroup that is called by the testbench to cause the coverpoints and crosses to sample data. PyVSC provides two ways to channel data from the testbench to the covergroup to be sampled when the sample method is called.
@vsc.covergroup
class my_covergroup(object):

    def __init__(self):
        self.with_sample(
            a=bit_t(4)
            )
        self.cp1 = vsc.coverpoint(self.a, bins={
            "a" : vsc.bin(1, 2, 4),
            "b" : vsc.bin(8, [12,15])
            })

cg = my_covergroup()
cg.sample(1)
cg.sample(12)
The first method for passing data to sample is to pass that data via the sample-method call. To use this method, your covergroup constructor must call the with_sample() method to specify the parameter names and types that will be accepted by the sample method. Note that the parameters need to be one of the PyVSC  types that we discussed last week. 

In the example above, the sample method will accept one parameter that is a 4-bit unsigned integer. Note that calling the with_sample() method will create attributes in the covergroup class that can be passed to coverpoint(s) as the variable to sample.

The second method for passing data for sampling to the covergroup is to specify the mapping when an instance of the covergroup class is created. 
@covergroup
 class my_covergroup(object):

     def __init__(self, a, b): # Need to use lambda for non-reference values
         super().__init__()

         self.cp1 = coverpoint(a,
             bins=dict(
                 a = bin_array([], [1,15])
             ))

         self.cp2 = coverpoint(b, bins=dict(
             b = bin_array([], [1,15])
             ))


 a = 0;
 b = 0;

 cg = my_covergroup(lambda:a, lambda:b)

 a=1
 b=1
 cg.sample() # Hit the first bin of cp1 and cp2

This approach uses Python lambda expressions to allow the covergroup to query the current value of variables when the sample method is called.

Reporting

Once we start collecting functional coverage data, we'll want to know which combinations have been covered and which have not been covered. PyVSC provides a couple of options for seeing what combinations have been covered and which have not. I'll cover a couple of the simple ones in this post, and we'll come back for the more-ambitious one in a future post.

The simplest approaches to querying coverage are via APIs and as text reports. Each instance of a covergroup class provides a get_coverage() method that returns the percentage of coverage goals that have been achieved. In other words, when no combinations have been covered, this method will return 0, and will return 100 when all have been achieved. 

PyVSC also provides several methods for creating a coverage report as a Python object, a string, and displaying the coverage report in the transcript. 

A textual coverage report looks something like this:

TYPE my_cg : 75.000000%
    CVP a_cp : 75.000000%
    Bins:
        a : 3
        a : 3
        a : 17
        a : 0
    INST my_cg : 75.000000%
        CVP a_cp : 75.000000%
        Bins:
            a : 3
            a : 3
            a : 1
            a : 0
    INST my_cg_1 : 100.000000%
        CVP a_cp : 100.000000%
        Bins:
            a : 3
            a : 3
            a : 3
            a : 6

The textual coverage report reports on each type of covergroup that is in use, and on every instance of that covergroup.

Coming up Next

If you're interested in investigating  PyVSC a bit more, please see the documentation on readthedocs.org. If you'd like to try out the library yourself, you can install it (Linux-only) for Python3 using pip:
% pip install pyvsc

The textual coverage report I showed above is interesting, but is a pretty simplistic way to look at coverage data. In my next post, I'll talk about how we can store our coverage data in a form that can be merged, reported, and displayed. 


Disclaimer
The views and opinions expressed above are solely those of the author and do not represent those of my employer or any other party.


Sunday, April 5, 2020

Python Verification Stimulus and Coverage: Data Types


In my last post, Modeling Random Stimulus and Functional Coverage in Python, I introduced a Python library for modeling random variables, constraints, and functional coverage. Starting with this post, I'll go through several aspects of the PyVSC library in greater detail. In this post, I'll cover the data types supported by PyVSC.

There are two reasons for doing this. For one thing, I think it's a useful way to describe the key features of the library (and hope you agree). The other reason is documentation. I don't do New Year's resolutions, but if I did one of mine this year would have been to do a better job of documenting my projects. For me, at least, documentation seems to be one of the hardest parts of a project -- or, at least, the easiest to defer and ignore. After coming back to a couple of my older projects and having to read code to figure out how to use them, I've decided that I need to invest more in documentation.

Fortunately, creating good documentation and making it readily-available has gotten much easier. Sphinx does a great job of converting ReStructured Text (RST) into nice-looking documentation. Read-the-docs ensures that the latest and greatest version of documentation is always just a click away. You can always find the latest PyVSC documentation here, and I'm investing more time in getting my other projects documented in the same way.

So, there you have it. My strategy is to introduce a set of PyVSC features in each of the next few posts. At the same time, I'll ensure the documentation for those features is in place. With that, let's dig in!

Verification Requires Being Specific with Datatypes

Increasingly, programming languages (looking at you, Python) are eager to separate the declaration of scalar data types from the way that they are represented. While C/C++, SystemVerilog, and Java all require the user to specify information about scalar data types -- width, sign, etc -- Python doesn't. An integer variable is as wide as it needs to be to hold the values the user wants to store in it. Furthermore, an integer variable doesn't have any notion of being signed or unsigned.

When verifying hardware, we need to be a bit more specific because we're working with designs that very much care about the representation of data types. The nets transferring data across a bus interface have a fixed width, and the data stored in registers has both a width and a sign. Consequently, the verification code we write must also be specific about the data it is sending and receiving from the design being verified.

So, when generating stimulus and collecting coverage, we definitely need to capture the width of each verification-centric variable, and whether it is signed or unsigned. With stimulus-generation , there is one other piece of information that we need to track: whether the variable is randomized. 

PyVSC and Scalar Datatypes

PyVSC uses specific data types for both constrained-random stimulus generation and for functional coverage collection. Like other randomization and coverage-collection frameworks, the use of specific data types provided by the library, instead of the language-provided built-in data types, serves two purposes. First, it allows the user to be sufficiently specific about the characteristics and meta-data of the data type. Second, it enables the library to capture expressions.

Currently, PyVSC supports three core categories of data type:

  • Integer scalar -- specific-bitwidth, signed and unsigned, random and non-random
  • Enumerated -- random and non-random variables 
  • Class -- random and non-random instances of a randobj class
@vsc.randobj
class my_s(object):

    def __init__(self):
        self.a = vsc.rand_uint8_t()
        self.b = vsc.uint16_t(2)
        self.c = vsc.rand_int64_t()
PyVSC provides pre-defined data-type classes that roughly correspond to the standard data types defined by the stdint.h C/C++ header file. These data-type classes have widths that are multiples of 8 bits, and specify the sign and randomness of the variable.

Width
Signed
Random
Non-Random
8
Y
rand_int8_t
int8_t
8
N
rand_uint8_t
uint8_t
16
Y
rand_int16_t
int16_t
16
N
rand_uint16_t
uint16_t
32
Y
rand_int32_t
int32_t
32
N
rand_uint32_t
uint32_t
64
Y
rand_int64_t
int64_t
64
N
rand_uint64_t
uint64_t
Just to keep things straightforward, PyVSC defines classes that capture all 16 combinations of width, sign, and randomness.

PyVSC also provides classes for capturing fields that have a width that is not a multiple of 8, or that is wider than 64 bits. 

First, an example:

@vsc.randobj
class my_s(object):

    def __init__(self):
        self.a = vsc.rand_int_t(27)
        self.b = vsc.rand_bit_t(12)


Signed
Random
Non-Random
Y
rand_int_t
int_t
N
rand_bit_t
bit_t

The Data Types chapter of the documentation contains more examples and details on how all of these data types are used.


PyVSC and Composite Data Types

In true object-oriented fashion, PyVSC supports composing larger randomizable classes out of smaller randomizable classes. 

@vsc.randobj
class my_sub_s(object):
    def __init__(self):
        self.a = vsc.rand_uint8_t()
        self.b = vsc.rand_uint8_t()

@vsc.randobj
class my_s(object):

    def __init__(self):
        self.i1 = vsc.rand_attr(my_sub_s())
        self.i2 = vsc.attr(my_sub_s())

In these cases, it's important to specify whether the class-type attribute should be randomized when the containing class is randomized. Decorating the attribute with rand_attr will cause the sub-attributes to be randomized. Not decorating the field, or decorating it with attr will cause the sub-attributes to not be randomized.

Accessing Attribute Values

It's quite common in randomization and coverage frameworks (eg SystemC SCV, CRAVE) to use method calls to access the value of randomizable class attributes. This is because the randomizable attributes are, themselves, objects.
PyVSC provides get_val() and set_val() methods for each scalar datatype provided by the library. In addition, PyVSC implements operator overloading for randobj-decorated classes. In most cases, this means that special randomizable class attributes operate just like any other scalar Python class attribute.

Coming up Next

In the next blog post, we'll look at PyVSC's support for modeling, capturing, and saving functional coverage data. Until then, feel free to check out the PyVSC documentation on readthedocs.io. If you'd like to experiment with PyVSC, install the pyvsc package from pypi.org or check out the PyVSC repository on GitHub.


Disclaimer
The views and opinions expressed above are solely those of the author and do not represent those of my employer or any other party.