Showing posts with label Verilog. Show all posts

Saturday, January 30, 2021

SoC Integration Testing: Higher-Level Software Debug Visibility


Debug is a key task in any development task. Whether debugging application-level software or a hardware design, a key to productive debug is getting a higher-level view of what is happening in the design. Blindly stepping around in source code or staring at low-level waveforms is rarely a productive approach to debugging. Debug-log messages provide a high-level view of what's happening in an software application, allowing us to better target what source we actually inspect. Testbench logging, coupled with a transaction-level view of interface activity, provides us that higher-level view when verifying IP-level designs. Much of this is lacking when it comes to verifying SoC integration.

Challenges at SoC Level
We face a few unique challenges when doing SoC-integration testing. Software (okay, really firmware) is an integral part of our test environment, but that software is running really really slowly since it is running at RTL-simulation speeds. That makes using debug messages impractical, since simulating execution of the code to produce messages makes our test software run excruciatingly slowly. In addition, the types of issues we are likely to find -- especially early on -- are not at the application-level anyway. 

Processor simulation models often provide some form of execution trace, such as ARM's Tarmac file, which provides us a window into what's happening in the software. The downsides, here, are that we end up having to manually correlate low-level execution with higher-level application execution and what's happening in the waveform. There are also some very nice commercial integrated hardware/software debug tools that dramatically simplify the task of debugging software at the source level and correlating that with what's happening in the hardware design -- well worth checking out if you have access.

RISC-V VIP
At IP level, it's common to use Verification IP to relate the signal-level view of implementation with the more-abstract level we use when developing tests and debugging. It's highly desirable, of course, to be able to use Verification IP across multiple IPs and projects. This requires the existence of a common protocol that VIP can be developed to comprehend. 

If we want VIP that exposes a higher-level view of a processor's execution, we'll need just such a common protocol to interpret. The good news is that there is such a protocol for the RISC-V architecture: the RISC-V Formal Interface (RVFI). As its name suggests, the RISC-V Formal Interface was developed to enable a variety of RISC-V cores to be formally verified using the same library of formal properties. Using the RVFI as our common 'protocol' to understand the execution of a RISC-V processor enables us to develop a Verification IP that supports any processor that implements the RVFI.

RISC-V Debug BFM
The RISC-V Debug BFM is part of the PyBfms project and, like the other Bus-Functional Models within the project, implements low-level behavior in Verilog and higher-level behavior in Python. Like other PyBfms models, the RISC-V Debug BFM works nicely with cocotb testbench environments.

Instruction-Level Trace
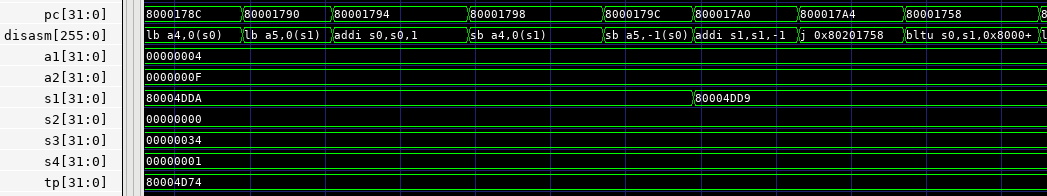
Like other BFMs, the Verilog side of the RISC-V Debug BFM contains various mechanics for converting the input signals to a higher-level instruction trace. Consequently, the signals that expose the higher-level view of software execution are collected in a sub-module of the BFM instance.


The image above shows the elements within the debug BFM. The ctxt scope contains the higher-abstraction view of software execution, while the regs scope inside it contains the register state.


The first level of debug visibility that we receive is at the instruction level. The RISC-V Debug BFM exposes a simple disassembly of the executed instructions on the disasm signal within the ctxt scope. Note that you need to set the trace format to ASCII or String (depending on your waveform viewer) to see the disassembly. 


C-Level Execution Trace
Seeing instruction execution and register values is useful, but still leaves us looking at software execution at a very low level. This is very limiting, and especially so if we're attempting to understand the execution of software that we didn't write -- booting of an RTOS, for example. 

Fortunately, our BFM is connected to Python and there's a readily-available library (pyelftools) for accessing symbols and other information from the software image being executed by the processor core.


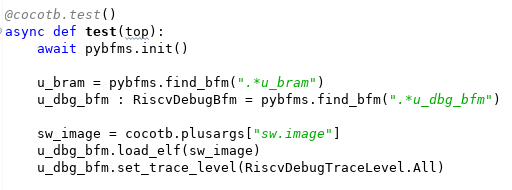
The code snippet above shows our testbench obtaining the path to the ELF file from cocotb, and passing this to the RISC-V Debug BFM. Now, what can we do with a stream of instruction-execution events and an ELF file? How about reconstructing the call stack?


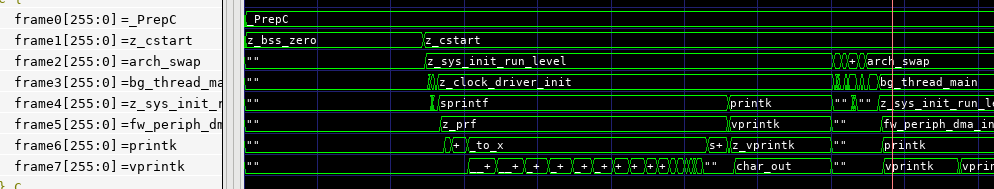
The screenshot above shows the call stack of the Zephyr OS booting and running a short user program. If we need to debug a design failure, we can always correlate it to where the software was when the failure occurred. 


The screenshot above covers approximately 2ms of simulation time. At this scale, the signal-level details at the top of the waveform view are incomprehensible. The instruction-level view in the middle are difficult to interpret, though perhaps you could infer something from the register values. However, the C-level execution view at the bottom is still largely legible. Even when function execution is too brief to enable the function name to be legible, sweeping the cursor makes the execution flow easy to follow.

Current Status and Looking Forward
The RISC-V Debug BFM is still early in its development cycle, with additional opportunities for new features (stay tuned!) and a need for increased stability and documentation. That said, feel free to have a look and consider whether having access to the features described above would improve your SoC bring-up experience.

Looking forward in this series of blog posts, we'll be looking next at some of the additional things we can do with the information and events collected by the RISC-V Debug BFM. Among other things, these will allow us to more tightly connect the execution of our Python-based testbench with the execution of our test software.

Finally, the process of creating the RISC-V BFM has me thinking about the possibilities when assembling an SoC from IPs with integrated higher-level debug. What if not only the processor core but also the DMA engine, internal accelerators, and external communication IPs were all able to show a high-level view of what they were doing? It would certainly give the SoC integrator a better view of what was happening, and even facilitate discussions with the IP developer. How would IP with integrated high-level debug improve your SoC bring-up experience?

Disclaimer
The views and opinions expressed above are solely those of the author and do not represent those of my employer or any other party.

Saturday, November 30, 2019

Adding Task-Based Bus Functional Models to Cocotb


Getting a project started -- even to a certain level of completeness -- is often pretty simple. A couple weekends of hacking often results in pretty good progress and results. Finishing things up, in contrast, is often a slow process. That has certainly been the case with some work I did back in May and June this year to prototype a task-based interface between Python and an HDL simulator. The proof-of-concept work I did at the time seemed quite promising, but the clear next step was to make that work more accessible to others. That "last little bit of work" has certainly turned out to take more time that I had originally assumed!

Just as a reminder, the motivation for interacting with an HDL environment at the task level is quite simple: performance. Communicating across language (especially interpreted language) boundaries tends to be expensive, so minimizing the number of cross-language communications is critical to achieving high throughput. Using a task-based interface between Python and an HDL environment boosts performance in three ways. First, a task-based interface groups data so fewer language-boundary crossings are required to communicate a given amount of data. Secondly, and more importantly, using a task-based interface enables the HDL environment to filter events and only interact with the Python environment when absolutely necessary. Finally, using a task-based interface enables integrations with high(er)-speed environments, such as emulation or the current release of Verilator, where signal-level integration isn't practical.

I started looking at Python as a testbench language for reasons that might initially seem strange: the Python ecosystem (primarily PyPi) that makes it easy to publish bits of library and utility code in a way that it is easily-accessible to others. Often, the ability to take advantage of the work of others is gated by the effort required to gather all the required software dependencies. The Python ecosystem promises to alleviate that challenge, and I was excited to explore the possibilities.

Where Does it Fit?
I'm aware of a few projects that use Python for verification, but it currently appears that Cocotb is the most visible Python-based testbench for doing hardware verification using Python testbench code. Consequently, it made very good sense to see whether the task-based integration I had prototyped could be integrated with the existing Cocotb library.

Cocotb is a Python library that supports light-weight concurrency via co-routines, and provides primitives for coordinating these co-routines with each other and with activity in a HDL simulation environment. In addition to the Python library, Cocotb provides native-compiled C/C++ libraries that integrate with the simulation environment via APIS implemented by the simulator (VPI, DPI, FLI, or VHPI depending on the simulator). Currently, Cocotb interacts with simulation environments at the signal level.

In considering how to add task-based interactions to Cocotb, there were a several requirements that I thought were quite important. First, the user should not be forced to choose between signal-level and task-based interactions between Python and HDL. It should be possible to introduce task-based interactions to a testbench currently interacting at the signal level, or add a few signal-based interactions to a testbench that primarily interacts at the task level. Secondly, a task-based integration must support a range of simulator APIs. I had prototyped a DPI-based integration, which is supported by SystemVerilog simulators, supporting Verilog and VHDL simulators as well was clearly important. Finally, achieving good performance was a key requirement, since performance is the primary motivation for using a task-based interface in the first place.

Task-Based BFM Cocotb Architecture


From a system perspective, the diagram above captures how task-based BFMs integrate with Cocotb. Each BFM instance is represented in the HDL environment by an instance of an HDL module. This module is special, in that it knows how to accept and make task calls and convert between signal-level information and those task calls.

Each BFM also knows how to register itself with a BFM Manager within Cocotb. When the HDL portion of a BFM registers with Cocotb, the BFM Manager creates an instance of a Python class that represents the BFM within the Python environment.

The BFM Manager provides methods to allow the user's test code to query the available BFMs and obtain a handle to the BFM instances required by the test. From there, the user's test simply calls methods on the Python class object and/or receives callbacks.

Task-Based BFM Architecture

Let's take a quick look at the work needed to support a task-based BFM. First off, the BFM author needs to a Python class to implement the Python side of the BFM. That class is decorated with a @cocotb.bfm decorator that associates HDL template files with the BFM class. Below is a BFM for a simple ready/valid protocol.

@cocotb.bfm(hdl={
    cocotb.bfm_vlog : cocotb.bfm_hdl_path(__file__,   "hdl/rv_data_out_bfm.v"),
    cocotb.bfm_sv   : cocotb.bfm_hdl_path(__file__, "hdl/rv_data_out_bfm.v")
})
class ReadyValidDataOutBFM():
    # ...


Next, the BFM author must specify the low-level interaction API with the HDL BFM. All calls must be non-blocking, so most interactions with the HDL environment are implemented as a request/acknowledge pair of API calls.

    @cocotb.bfm_import(cocotb.bfm_uint32_t)
    def write_req(self, d):
        pass
    
    @cocotb.bfm_export()
    def write_ack(self):
        self.ack_ev.set()

Calling a class methods decorated with @cocotb.bfm_import will result in a task call in the HDL BFM. Class methods decorated with @cocotb.bfm_export can be called from the HDL BFM.

Finally, on the Python side, the BFM author will likely provide a convenience API to simplify the testwriter's life:

    @cocotb.coroutine
    def write_c(self, data):
        '''
        Writes the specified data word to the interface
        '''
        
        yield self.busy.acquire()
        self.write_req(data)

        # Wait for acknowledge of the transfer
        yield self.ack_ev.wait()
        self.ack_ev.clear()

        self.busy.release()


There's one piece left, and that's the HDL BFM. This is specified as a template:

module rv_data_out_bfm #(
parameter DATA_WIDTH = 8
) (
input clock,
input reset,
output reg[DATA_WIDTH-1:0] data,
output reg data_valid,
input data_ready
);
reg[DATA_WIDTH-1:0] data_v = 0;
reg data_valid_v = 0;
always @(posedge clock) begin
if (reset) begin
data_valid <= 0;
data <= 0;
end else begin
if (data_valid_v) begin
data_valid <= 1;
data <= data_v;
data_valid_v = 0;
end
if (data_valid && data_ready) begin
write_ack();

if (!data_valid_v) begin
data_valid <= 0;
end
end
end
end
task write_req(reg[63:0] d);
begin
data_v = d;
data_valid_v = 1;
end
endtask

// Auto-generated code to implement the BFM API
${cocotb_bfm_api_impl}

endmodule

The BFM author must implement tasks that will be called from the Python class. Task proxies that will invoke Python methods are implemented by the Cocotb automation, and substituted into the template where the ${cocotb_bfm_api_impl} tag is specified.

Current Integrations
Currently, task-based BFM integrations are implemented for Verilog via the VPI interface and for SystemVerilog via the DPI interface. A VHDL integration isn't currently supported, but that's on the roadmap. One complication with VHDL is that there are actually several interfaces that may need to be supported depending on the simulator -- VHPI, VHPI via VPI, Modelsim FLI. Here I could use some input from the community on priorities, so I'd definitely like to hear from you if you're using Cocotb with VHDL...

Results
As I mentioned at the beginning of this post, performance is the primary reason for using task-based interaction between Python and a HDL environment. So, how much improvement can you expect? Well, that entirely depends on how frequently your tests interact with the HDL environment and, to a certain extent, on how long your tests are. If your testbench needs to interact with the testbench every clock cycle, then you're unlikely to see much benefit. If, however, your testbench spends quite a few cycles waiting for the design to respond, then you're likely to see pretty significant benefits.

I'll use my FWRISC (Featherweight RISC) RISCV core as an example. In this environment, the bulk of the test is actually compiled code that executes on the processor. The Python testbench is primarily responsible for checking results and providing debug information when needed.
A diagram of the simulation-based testbench is shown above. The Tracer BFM is responsible for monitoring execution of the FWRISC core and sending events up to the high-level testbench as needed. These events include:
  • Instruction executed
  • Register written
  • Memory written
I've created two Cocotb implementations of this BFM: one that interacts at the signal level, and one that interacts at the task level. To compare the performance, I'm running a Zephyr test with Icarus Verilog for 10ms of simulation time.

Let's start with as close to a direct comparison as possible. Both the signal-level and task-based BFM will capture the same information and propagate it to the Python testbench.
  • Signal-Level BFM: 85s (wallclock)
  • Task-Level BFM: 33s (wallclock)
Okay, so already we're looking pretty good. This performance increase is simply because the task-based BFM doesn't need to call the Python environment every cycle. 

Another way we can benefit is to use a higher-performance simulator. Icarus Verilog is interpreted, and supports a full event-driven simulation environment. Verilator has a much more restricted set of features (synthesizable Verilog only, limited signal-level access, etc), but is also much faster. It also doesn't currently support the signal-level access to the extent necessary to do a direct comparison between a task-based BFM and a signal-level BFM. So, how do we look here? I actually had to increase the simulation time to 100ms (10x longer) to get a meaningful reading.
  • Task-Level BFM: 18s (wallclock)
So, coupling a fast execution platform with an efficient integration mechanism definitely brings benefits!

Next Steps
So, where do we go from here? Well, please stay tuned for my next blog post to get more details on how create task-based BFMs using these features. I also have an active pull request (#1217) to get this support merged into Cocotb directly. Until then, you can always access the code here


Disclaimer
The views and opinions expressed above are solely those of the author and do not represent those of my employer or any other party.

Saturday, December 8, 2018

FWRISC: Sizing up the RISC-V Architecture


After deciding on October 22nd to create a RISC-V implementation to enter in the 2018 RISC-V soft-core contest (with entries due November 26th), I needed to gather more information of the RISC-V ISA in general, and the RV32I subset of the ISA specifically. I had previously done some work in RISC-V assembly -- mostly writing boot code, interrupt handlers, and thread-management code. But I certainly hadn't explored the full ISA, and certainly not from the perspective of implementing it. Bottom line, I needed a better understanding of the ISA I needed to implement.

Fundamentals of the RISC-V ISA
The first thing to understand about the RISC-V architecture is that it came from academia. If you took a computer architecture course and read the Patterson and Hennesy book, you read about some aspects of one of the RISC-X family of instruction sets (RISC-V is, quite literally, the 5th iteration of the RISC architecture developed at UC Berkeley).

Due in part to its academic background, the ISA has both been extended and refined (restricted) over time -- sometimes in significant and sometimes in insignificant ways. This ability to both extend and change the ISA is somewhat unique when it comes to instruction sets. I'm sure many of you reading this are well-aware of some of the baggage still hanging around in the x86 instruction set (string-manipulation instructions, for example). While many internal protocols, such as the AMBA bus protocol, often take a path of complex early specification versions followed by simpler follow-on versions, instruction set architectures often remain more fixed. In my opinion, the fact that the RISC-V ISA had a longer time to incubate in a context that did not penalize backwards-incompatible changes has resulted in an architecture that is cleaner and easier to implement.

The RISC-V ISA is actually a base instruction-set architecture, and a family of extensions. The RV32I (32-bit integer) instruction set forms the core of the instruction-set architecture. Extensions add on capabilities such as multiply and divide, floating-point instructions, compressed instructions, and atomic instructions. Having this modular structure defined is very helpful in enabling a variety of implementations, while maintaining a single compiler toolchain that understands how to create code for a variety of implementations.
The RISC-V soft-core contest called for an RV32I implementation, though implementations could choose to include other extensions. The RV32I instruction set is actually very simple -- much simpler than other ISAs I've looked at in the past:
  • 32 32-bit general-purpose registers
  • Integer add, subtract, and logical-manipulation instructions
  • Control-flow instructions
  • Load/store instructions 
  • Exceptions, caused by a system-call instruction and address misalignment
  • Control and status registers (CSRs)
  • Cycle and instruction-counting registers
  • Interestingly enough, interrupts are not required
In total, the instruction-set specification states that there are 47 instructions. I consider the RV32I subset to actually contain 48 instructions, since ERET (return from exception) is effectively required by most RV32I software, despite the fact that it isn't formally included in the RV32I subset. 

On inspection, the instruction-set encoding seemed fairly straightforward. So, where were the implementation challenges?
  • CSR manipulation seemed a bit tricky in terms of atomic operations to read the current CSR value, while clearing/setting bits.
  • Exceptions always pose interesting challenges
  • The performance counters pose a size challenge, since they don't nicely fit in FPGA-friendly memory blocks
Despite the challenges, the RV32I architectural subset is quite small and simple. This simplicity, in my opinion, is the primary reason it was possible for me to create an implementation in a month of my spare time. 

Implementation Game Plan
For a couple or reasons, I elected to use a simple approach to implementation of the RISC-V ISA. First, the deadline for the contest was very close and I wanted to be sure to actually have an entry. Secondly, my thinking was that a simple implementation would result in a smaller implementation.
Since I was interested in evolving Featherweight RISC after the contest, a second-level goal with the initial implementation was to build and prove-out a test suite that could be used to validate later enhancements.

The implementation approach I settled on was state-machine based -- not the standard RISC pipelined architecture. Given that I was targeting an FPGA, I also planned to move as many registers as possible to memory blocks.

Next Steps
With those decisions made, I was off create an implementation of the RISC-V RV32I instruction set! In my next post, I'll discuss the test-driven development approach I took to implementing the Featherweight-RISC core.

Disclaimer


The views and opinions expressed above are solely those of the author and do not represent those of my employer or any other party.

Saturday, December 1, 2018

FWRISC: Designing an FPGA-friendly Core in 30 Days


Designing a processor is often considered to be a large and complex undertaking, so how did I decide to design and implement in a month? For a few reasons, really. For one, my background is in hardware design, despite having worked in the EDA (Electronic Design Automation) software industry for many years. The last time I did a full hardware design was quite a few years ago using an i386EX embedded processor and other packaged ICs. Recently, though, I've been looking for opportunities to brush up on my digital-design skills. The primary reason, however, was that I saw the call for contestants in the 2018 RISC-V soft-core processor contest. I've found contests to be a fun way to learn because the organizers' criteria often cause me to learn something I otherwise wouldn't have thought to investigate. This contest was certainly no different!

The 2018 RISC-V contest certainly had some unique criteria. The contest required that verification be done using the Verilator "simulator", an open-source Verilog to C++ translator that is very fast and powerful, but also has some interesting quirks. Also required was support for Zephyr, a real-time operating system (RTOS) that I certainly wasn't aware of before the contest. Most interesting to me, though, was the contest category for smallest RISC-V FPGA implementation.

Small, you say?
When thinking about processor design, I often think about maximizing performance. However, there are many applications -- especially in the IoT space -- where having a small amount of processing power that requires little resources is very important. Often these applications are dominated today by older processor architectures, such as the venerable 8051. Despite it's somewhat-small size in an FPGA implementation, the 8051 processor isn't terribly friendly to C compilers, and is very slow. What if a modern architecture, such as the RISC-V ISA, could take the place of these older architectures while matching, or even improving, on their small size?

Despite seeing the value of having small RISC-V implementations, my first reaction when seeing the contest announcement was puzzlement. Weren't there already several small RISC-V implementations? Well, as it turns out, yes and no. There were several existing small implementations. However, the ones I found were not truly compliant with the RV32I architecture specification. The tradeoffs taken were often taken to reduce the implementation size by removing features that required resources, but were not needed for the author's intended application. These tradeoffs often meant that a special compiler toolchain was needed, or that users needed to be cautious when attempting to reuse existing software written for the RISC-V ISA.

Results?
Well, bottom line, I was able to design, verify, and implement a 32-bit RV32I RISC-V core in 30 days, and you can find the code on GitHub. A netlist of the design is shown at the beginning of this post. Early results are quite promising with respect to the balance between performance and size, and there are several known areas for improvement. Through the process, I've learned a lot -- rediscovering RTL design, gaining a much deeper appreciation of the RISC-V ISA, and learning about new tools like Verilator and infrastructure like Zephyr. Over the next few weeks, I'll be writing more about specific details of the design and verification process and what I learned. So, stay tuned for future posts!

Disclaimer
The views and opinions expressed above are solely those of the author and do not represent those of my employer or any other party.

Wednesday, January 17, 2018

DVKit: Setting up SystemVerilog Development


In my last post on DVKit, I described how Eclipse uses projects to group source files, and uses workspaces to organize the projects and settings for a given development session. In this post, I'll start to dig into the support that DVKit provides for developing SystemVerilog.

DVKit includes the SVEditor plugin (http://sveditor.org), an open source Eclipse plug-in for developing SystemVerilog files. SystemVerilog is an object-oriented language that has similarities to C++ and Java. Unlike C++ and Java, though, SystemVerilog has strong ordering dependencies between files. C++ files can be independently analyzed because each C++ source file must include its dependencies and specify the namespace its content is in (if any). Java is even a bit more structured, requiring the class name and file name to match, and (effectively) requiring the directory structure to match the package namespace structure.

In contrast, all content in a SystemVerilog package must effectively be included in a single file. The pre-processor provides a level of workaround to enable classes to be stored in a separate file from the package file that includes them. However, this all adds up to make setting up source analysis for a SystemVerilog file a bit more detail-oriented than for other source languages.

In this post, I'll walk through setting up an Eclipse (DVKit) project for the UBus example from the UVM-1.2 library. I downloaded UVM here.

Creating a SystemVerilog Project

As mentioned in the last post, Eclipse makes it easy to create a project around existing source code. In this case, we know we will be working with SystemVerilog source, so we start by creating a new SVE Project. The wizard is found inside the SVEditor category, as shown below.


After selecting the proper wizard for project creation, we need to specify the particulars of the project:


Specifically, in this case:
  • ubus -- The name of the project
  • c:\usr1\fun\dvkit\uvm-1.2\examples\integrated\ubus -- The location of the ubus project within the UVM tree

Specifying Root Files

Since the ubus project contains existing sources, we next want to specify the root files so they can be indexed. SystemVerilog files need to be parsed in a very specific order, so it's important to only process the top-level files.

To do this, we first create a New Filelist on the Filelists page of the new SVE Project wizard. The filelist can be named anything, but the default (sve.f) is fine.


The next page is where the magic happens. 
  • Select the check box next to the 'ubus' project. This will cause all files with a SystemVerilog suffix (.sv, .svh, etc) to be selected
  • Click on the 'Compute Filelist' button. This pre-processes all source files and eliminates any files that are included by another. 
  • The resulting root files are displayed in the Filelist Contents box

Checking out the new Project

At this point, we've specified the root files in our project in such a way that the SVEditor plug-in can locate and parse them. We can now click Finish on the wizard and see the completed project.

Hmm... Okay, so we have a problem. Seems some macros from the UVM library can't be located. Of course, this isn't really surprising given than we haven't told the SVEditor plug-in to parse the UVM files.

Adding External Sources

Eclipse provides several ways to reference project-external source files. The easiest in this case is to just add the UVM library to the filelist that we already created.

We edit the sve.f file that we created during the project-creation process, and add two absolute paths to where we unpacked the UVM bundle:
  • +incdir+<uvm_install>/src
  • <uvm_install>/src/uvm_pkg.sv
After saving the file, we now have a project without errors.

Results


The payoff for properly configuring our SystemVerilog source project is that we can more-productively work with our SystemVerilog sources. In the screenshot above, the hover pop-up is displaying the documentation for the uvm_driver class. 

In future blog posts I'll dig into more features of Eclipse, DVKit, and plug-ins like SVEditor. For now, just a reminder that you can always download the completely open source DVKit here.

Sunday, January 7, 2018

DVKit: Workspaces, Projects, and Legacy Code


In Part 1 of this series, I introduced DVKit, an Eclipse-based IDE for files types used by DV engineers. If you're used to editing your source files with a single-file editor like Vi/Vim or Emacs, moving to an integrated development environment can take some getting used to. Single-file editors don't require any context (in fact, do not take advantage of any context) beyond the file on which they have been invoked. In contrast, IDEs require context for a file in order to provide many of the project-centric features that they provide.

Eclipse, like many integrated development environments, provides a variety of flexible features with which to specify the context of the files being developed. In this post, I'll describe the best practice fundamentals I've developed over the years when setting up development projects. Future posts will explore a few additional features that are very helpful in some cases.


Projects 

Eclipse provides two fundamental features for working with code: projects and workspaces (shown above). A project is represented by a directory that includes the sources being developed and some meta-data files with information about the language (eg Java) being used and how that language should be processed (eg assume Java 7). Some of this information is captured in a file named '.project' that is present in all Eclipse projects, and some will be captured in toolchain-specific files.

An Eclipse session can have multiple projects open at any given time.

Workspaces

Eclipse uses a workspace to capture a development session. A workspace records the projects that are open, the windows that are open and their positions and sizes, etc. In contrast to projects, a workspace typically does not contain any actual code -- just the preferences and settings used while developing code.

Projects are associated with a workspace in two ways:
  • When a project is created, it is automatically added to the active workspace
  • An existing project can be imported into the active workspace
In both cases, a link is added from the workspace to where the project is located on the filesystem. The project and its files will be visible in the workspace, but you are actually editing the files within the project directory, as shown in the diagram above.


I typically create a workspace for each codeline that I'm working on. So, I might have a workspace for "sveditor-master" and one for "sveditor-fast-indexer".

Working with Existing Code

If you're getting started with an Eclipse-based IDE like DVKit, you likely have lots of existing code and no existing Eclipse projects. So where do you start? Well, the good news is that Eclipse projects fit very nicely around existing code. You just need to decide what the primary language for the project is, and create the right project.

Let's say I want to work on files from the Linux Device Tree Compiler (DTC), and that I've cloned a copy of the repository (git://git.kernel.org/pub/scm/utils/dtc/dtc.git) to c:/usr1/fun/dvkit/tutorial/dtc.
After launching DVKit, I would launch the 'New C Project' wizard (New->Project... ) to create a new project for editing C code.


The next wizard allows me to provide specifics about the project I want to work on.


  • What is the project named? 'dtc'
  • Where is it located? On the filesystem at c:/usr1/fun/dvkit/tutorial/dtc
  • How are the source files compiled? With a Makefile
After completing this wizard, the 'dtc' project will be visible in the workspace:


Now the source files from the 'dtc' project are visible in the workspace and available for editing. In the future, we can bring the 'dtc' project into another workspace by running the Eclipse Import wizard to import an existing project.

Conclusion

The Eclipse project construct allows project-specific settings to be associated with source code, while the workspace construct enables users to manage session-specific settings. Eclipse's ability to construct a project around existing source code makes it easy to use Eclipse to develop existing code.

As always, you can download the freely-available Eclipse-based DVKit here: https://sourceforge.net/projects/dvkit/files/

Tuesday, January 2, 2018

DVKit: More-productive Code Development for DV Engineers


If you're a design verification (DV) engineer, how many different languages do you code in every day? If you're like me, the number is significant. On any given day, I might find myself working on SystemVerilog, PERL, shell script, Makefile, even C++. Text editors like Vim and a host of others can edit any text file, and even provide some basic syntax coloring.

How Do Integrated Development Environments Help?

Integrated Developmene Environments (IDEs) provide features far beyond those provided by simple text editors. While a text editor is typically aware of the current file being edited, an IDE is aware of the files related to the current file being edited. An IDE typically provides syntax and semantic checking for code as it is developed, which results in more accurate code creation and fewer mistakes being discovered during compilation. An IDE also provides features for navigating across the content of the code being developed -- for example, navigating to the declaration of a class from its usage. IDEs also provide on-the-fly content assist based on the declarations in the code under development -- for example, prompting the user with the methods available in a specific class.

There are a number of IDEs available, but many tend to focus on a handful of languages. Visual Studio, for example, focuses on C, C++, and C#. NetBeans focuses on Java and web languages. With the large variety of languages used for design verification, we need an IDE with support for the same large variety of languages.

Eclipse

If you're looking for a true integrated development environment (IDE) for multiple languages, the Eclipse platform is a natural choice. Originally developed by IBM as an integrated development environment for Smalltalk and Java, Eclipse has evolved into an open source platform that supports development of a dizzying array of languages -- from Java to C++ to ANTLR and beyond. As an integrated development environment, Eclipse not only provides text editing and syntax highlighting, it provides support for easily navigating code structure. For example, navigating from where a field is used to where it was declared.

DVKit

I've used Eclipse as a primary development tool for the past 12 years or so. Eclipse follows a plug-in-based architecture, and makes it easy to install new plug-ins for developing various languages. So, it's not terribly difficult to "roll your own" installation of Eclipse that contains your favorite plug-ins. About four years ago, I realized that there were two challenges with continuing to roll my own. First, it was time consuming. Remembering the web sites for all my favorite plug-ins and installing them every time a new version of Eclipse was released, on every development machine I use, was a hassle. Second, I didn't have a good way to share my favorite collection of Eclipse plug-ins with others.

So, about four years ago I created DVKit. DVKit is based on Eclipse and packages all my favorite plug-ins for developing languages such as:
  • SystemVerilog
  • PERL
  • Python
  • Shell
  • C/C++
  • Java
  • Javascript
  • Scala
  • Makefile
  • TCL
  • XML
  • YAML
DVKit is available for Linux, Windows, and Mac OS-X. On Windows, an installer is available to make it extra simple.

You can find DVKit at http://dvkit.org, and the downloads page here.

Over the next few blog posts, I'll introduce you to the fundamentals of developing code with DVKit and Eclipse, and some of the language-specific features provided with DVKit. In the meantime, I would encourage you to download DVKit and begin to explore how an IDE can help boost your development productivity.